Screenshots
See the Examples page for a few more screenshots and the example code to generate them. If you have a nice screenshot of some fancy data yourself, feel free to e-mail me!
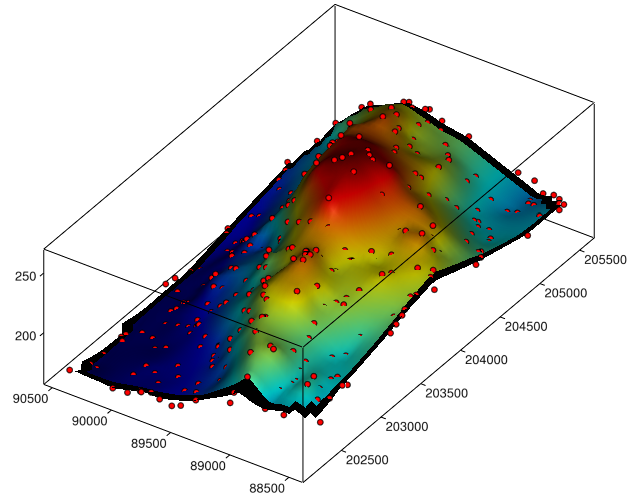
Martin Laloux is testing the use of visvis in Quantum GIS (http://www.qgis.org/), an open source Geographical Information System which is scriptable in Python. He extracts the x, y, z coordinates of a point layer and uses vivis to visualize them in 3D:
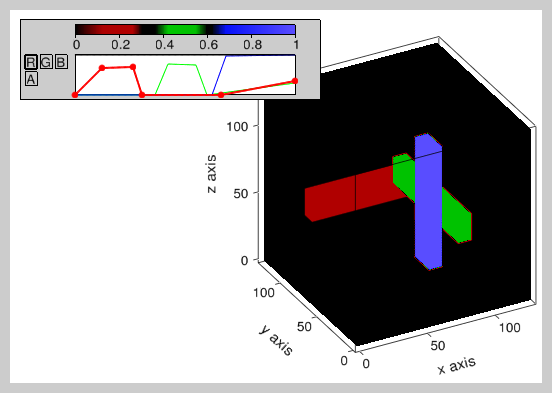
An example of the ColormapEditor in action:
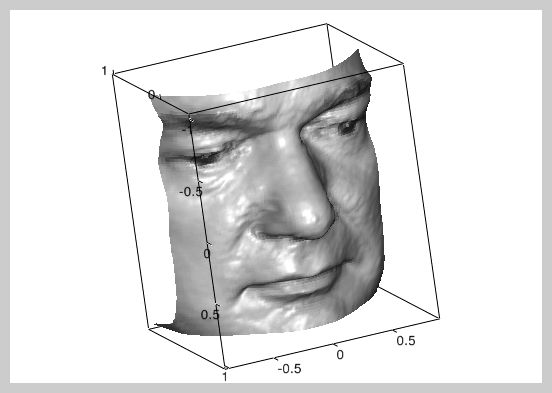
Asmi Shah uses Visvis to visualize 3D color microscopic images. What you see here is a "zebrafish embryo's brain region, zoomed in at its right eye, at 48hpf". The RGB dataset has 512x512x213 voxels.

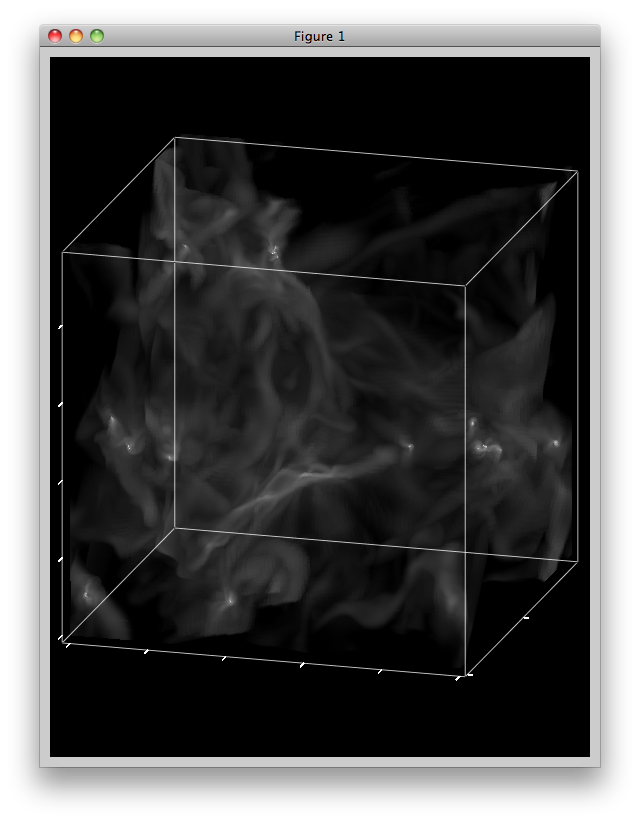
Matthew Turk uses Visvis to visualize the formation of the first starts in the universe:
The image below shows a surface plot of a 3D phase (courtesy of Bas Boom):
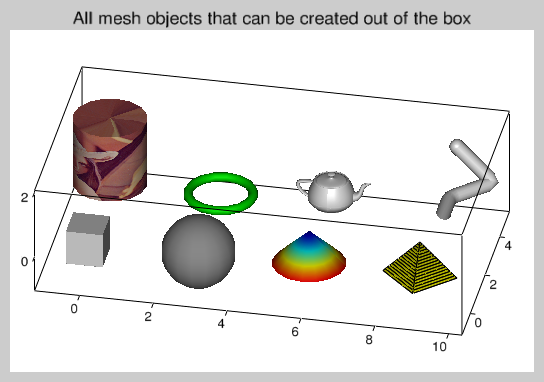
Here's a screenshot created by one of the scripts in the examples directory. It illustrates several polygonal shapes that can be created and applies a colormap and texture to a few of them:
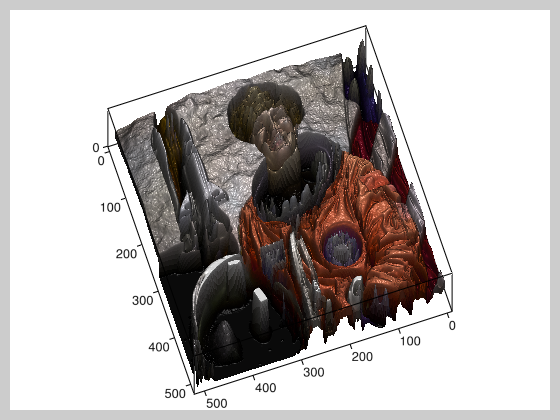
The image below shows a surface plot of the intensity of Lena.png, with the Lena texture itself applied to the Mesh:
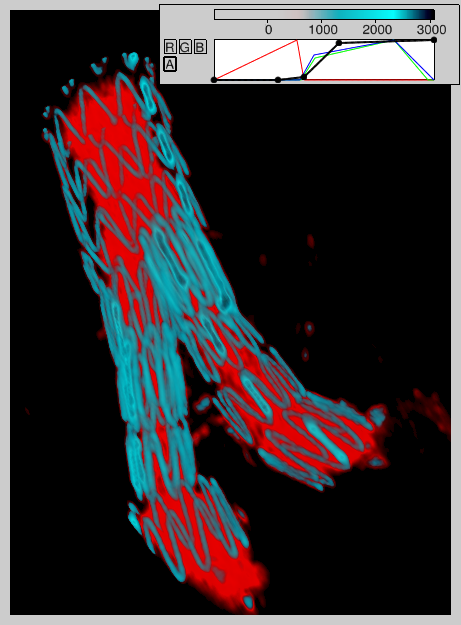
Here's an image of a stent graft visualized using the raycast render program. Contrast fluid was injected in the bloodstream during acquisition of the CT scan, which enables distinguishing it from the surrounding tissue:
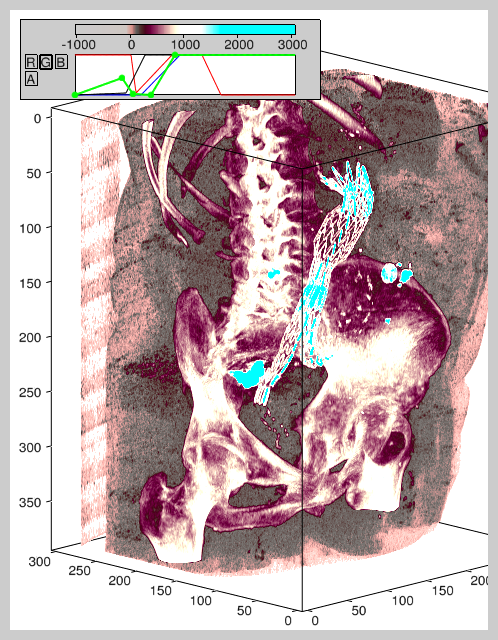
Here's another stent, also showing the pelvic bone (using the MIP renderer):
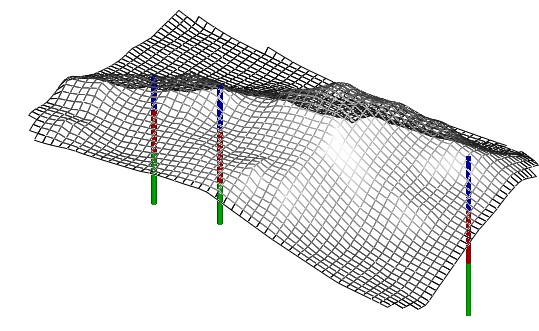
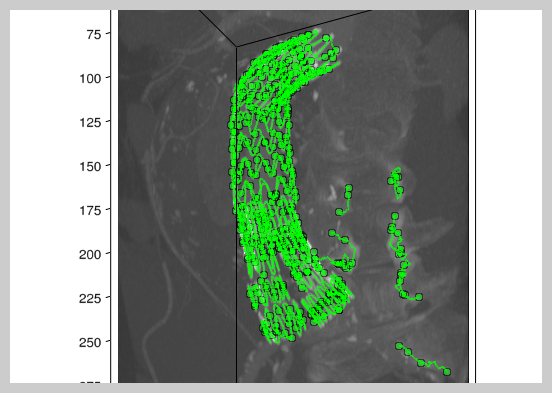
Lines can be visualized inside volumes (by setting their alpha value <1.). This way one can visualize all sorts of algorithm results:
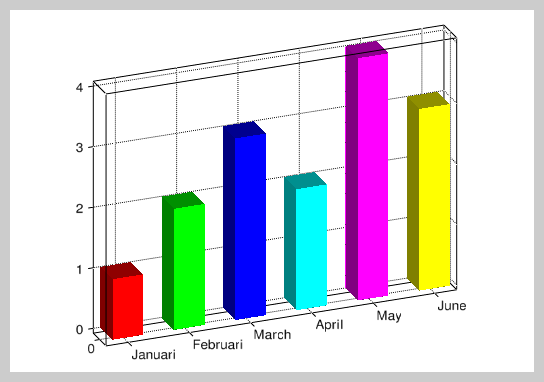
A bar chart: