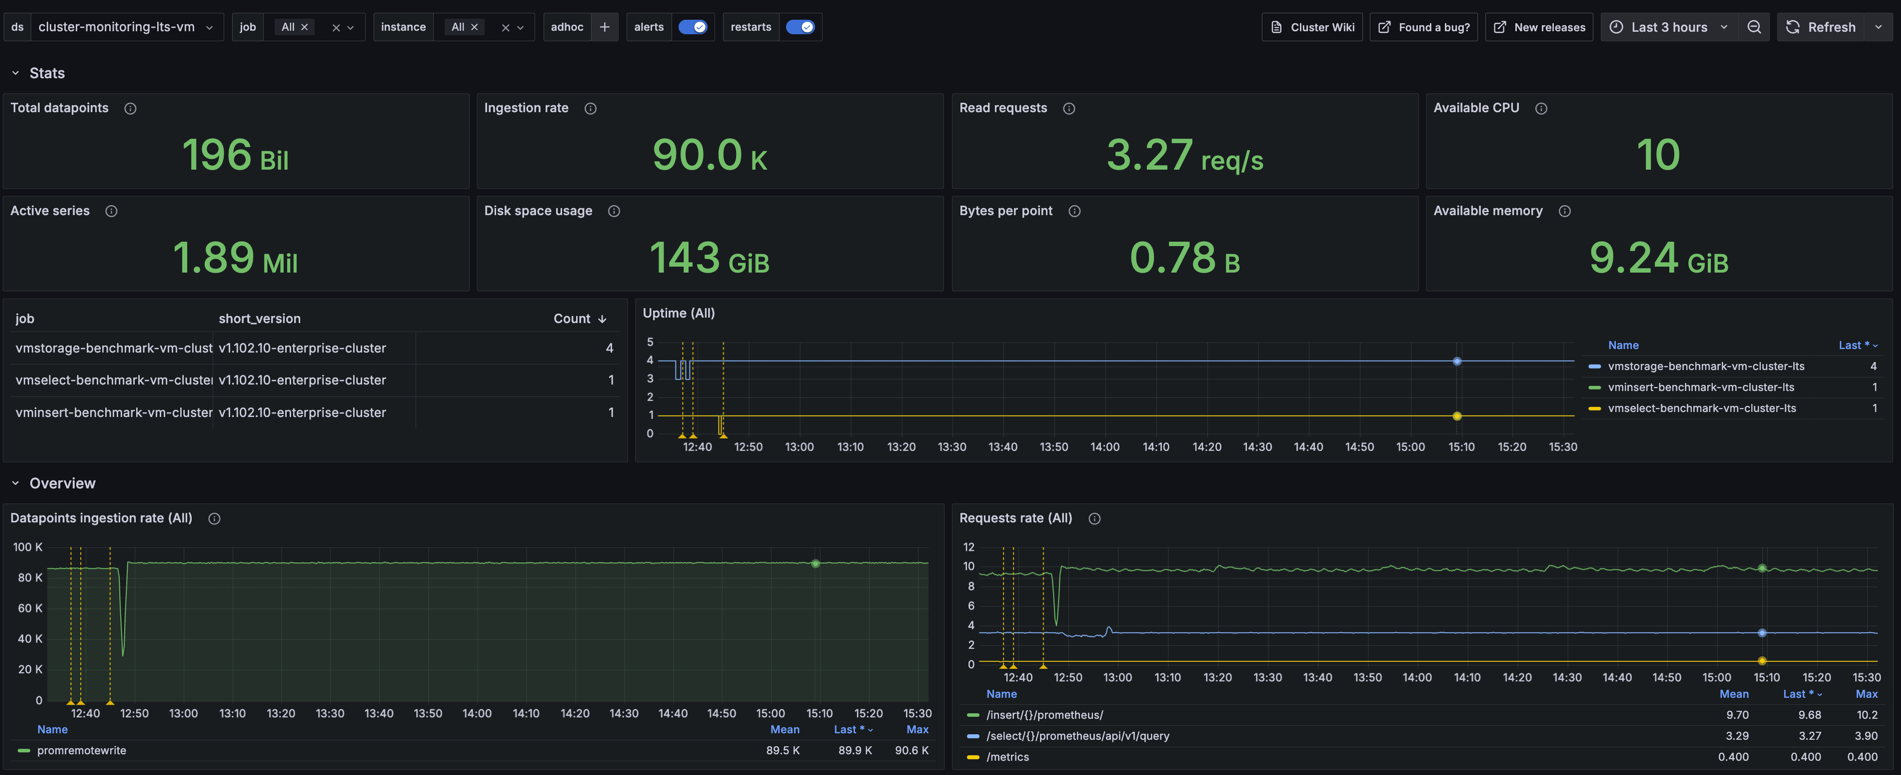
The VictoriaMetrics Grafana plugin allows Grafana to query, visualize, and interact with VictoriaMetrics, a high-performance metrics storage and processing system.
- Use MetricsQL to query metrics in Grafana.
- Use Explore mode with Grafana.
- Build dashboards and setup alerts.
- Use Ad Hoc filters.
- Template queries and expressions.
- Get insights about query execution bottlenecks via tracing.
- Automatically format queries via
Prettifybutton.
Try it at VictoriaMetrics playground!
For detailed instructions on how to install the plugin on Grafana Cloud or locally, please checkout the Plugin installation docs.
Once the plugin is installed on your Grafana instance, follow these instructions to add a new VictoriaMetrics data source, and enter configuration options.
Provision of Grafana plugin requires to create datasource config file:
apiVersion: 1
datasources:
  - name: VictoriaMetrics
    type: victoriametrics-metrics-datasource
    access: proxy
    url: http://victoriametrics:8428
    isDefault: true

  - name: VictoriaMetrics - cluster
    type: victoriametrics-metrics-datasource
    access: proxy
    url: http://vmselect:8481/select/0/prometheus
isDefault: falseVictoriaMetrics query language is MetricsQL - query language inspired by PromQL. MetricsQL is backwards-compatible with PromQL, so Grafana dashboards backed by Prometheus datasource should work the same after switching from Prometheus to VictoriaMetrics. However, there are some intentional differences between these two languages.
Queries can be built using raw MetricsQL or via QueryBuilder. Overall, dashboarding experience is the same as with Prometheus datasource.
See panels examples at VictoriaMetrics playground.
The WITH templates feature simplifies the construction and management of complex queries. You can try this feature in the WITH templates playground.
The "WITH templates" section allows you to create expressions with templates that can be used in dashboards.
WITH expressions are stored in the datasource object. If the dashboard gets exported, the associated WITH templates will not be included in the resulting JSON (due to technical limitations) and need to be migrated separately.
- Navigate to the dashboard where you want to add a template.
Note: templates are available within the dashboard scope. - Click the
WITH templatesbutton. - Enter the expression in the input field. Once done, press the
Savebutton to apply the changes. For example:
commonFilters = {instance=~"$node:$port",job=~"$job"},

\# cpuCount is the number of CPUs on the node
cpuCount = count(count(node_cpu_seconds_total{commonFilters}) by (cpu)),

\# cpuIdle is the sum of idle CPU cores
cpuIdle = sum(rate(node_cpu_seconds_total{mode='idle',commonFilters}[5m]))
You can specify a comment before the variable and use markdown in it. The comment will be displayed as a hint during auto-completion. The comment can span multiple lines.
After saving the template, you can enter it into the query editor field:
((cpuCount - cpuIdle) * 100) / cpuCount
Thus, the entire query will look as follows:
WITH (
 commonFilters = {instance=~"$node:$port",job=~"$job"},
 cpuCount = count(count(node_cpu_seconds_total{commonFilters}) by (cpu)),
 cpuIdle = sum(rate(node_cpu_seconds_total{mode='idle',commonFilters}[5m]))
)
((cpuCount - cpuIdle) * 100) / cpuCount
To view the raw query in the interface, enable the Raw toggle.
Make sure that VictoriaMetrics datasource plugin is installed, and a new datasource is created from the plugin.
Each panel in Grafana dashboard has a datasource dropdown when in Edit mode. Just choose the VictoriaMetrics datasource instead of Prometheus datasource in dropdown.
If datasource is configured via Grafana variable, then change variable to VictoriaMetrics datasource type.
Grafana doesn't allow forwarding Alert requests to alerting API /api/v1/rules for plugins which are not of Prometheus or Loki type.
See more details here.
This project is licensed under the AGPL-3.0-only.
