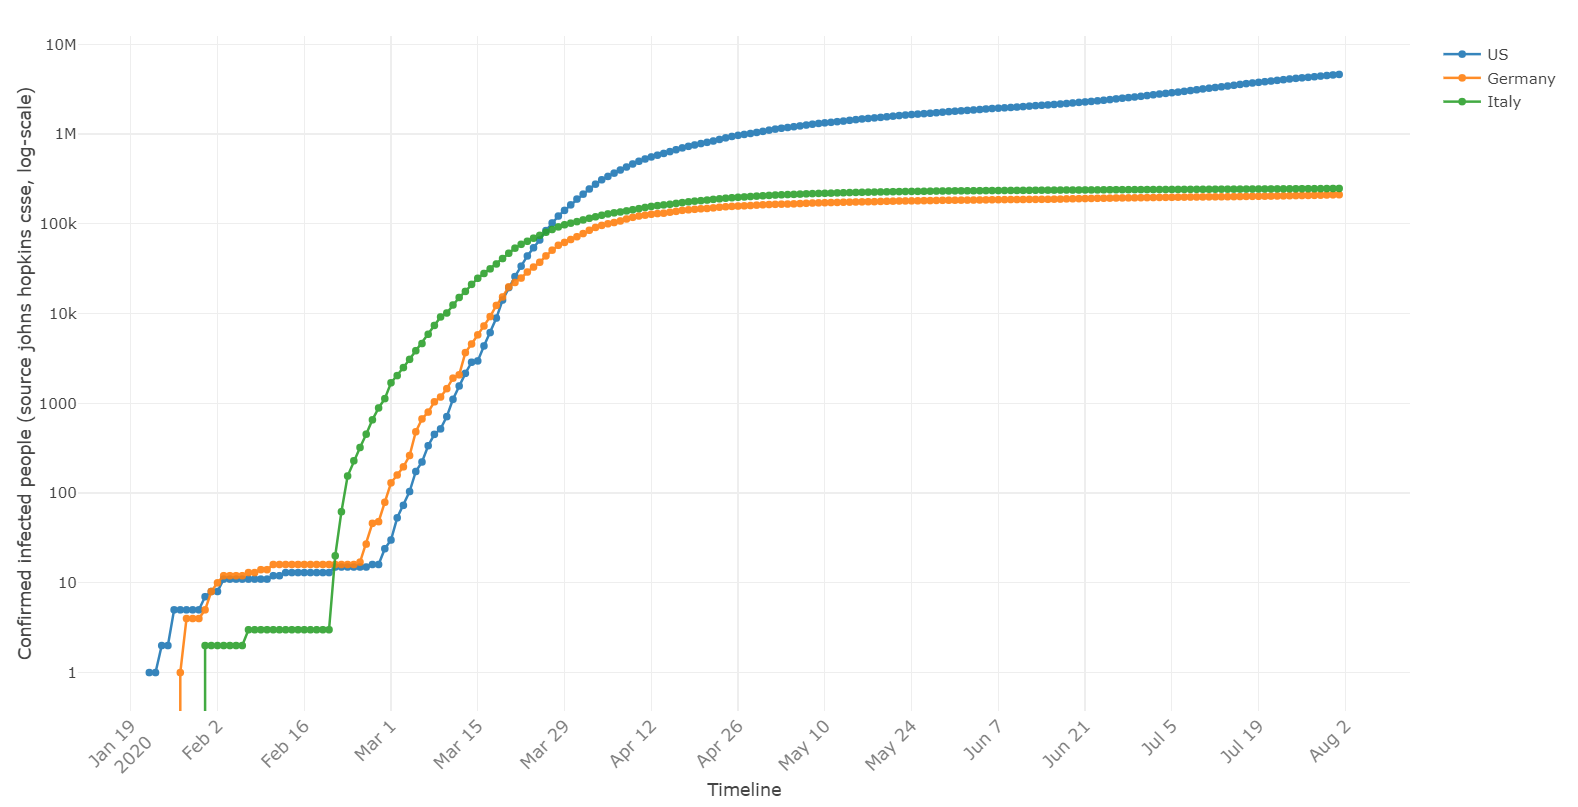
A dynamic dashboard of COVID-19 data with filtered and calculated data sets like the current Doubling Rate of confirmed cases. The dynamic dashboard also contains a simulation of the SIR model.
Data source: Johns Hopkins GITHUB - https://github.com/CSSEGISandData/COVID-19
Run python file src/visualization/visualize.py to run the DASH server. It will first pull the latest data from Johns Hopkins GITHUB, build the processed datasets and then run the dash server.
The dashboard has 2 tabs:
The required countries can be selected in the first dropdown menu - multiple countries can be selected for comparison. If required, the filtered data or the doubling rate can be plotted using the second dropdown menu.
This is for simulation of the SIR model. The required country can be selected using the dropdown menu.
