-
Notifications
You must be signed in to change notification settings - Fork 5
/
Copy pathindex.json
309 lines (1 loc) · 787 KB
/
index.json
1
2
3
4
5
6
7
8
9
10
11
12
13
14
15
16
17
18
19
20
21
22
23
24
25
26
27
28
29
30
31
32
33
34
35
36
37
38
39
40
41
42
43
44
45
46
47
48
49
50
51
52
53
54
55
56
57
58
59
60
61
62
63
64
65
66
67
68
69
70
71
72
73
74
75
76
77
78
79
80
81
82
83
84
85
86
87
88
89
90
91
92
93
94
95
96
97
98
99
100
101
102
103
104
105
106
107
108
109
110
111
112
113
114
115
116
117
118
119
120
121
122
123
124
125
126
127
128
129
130
131
132
133
134
135
136
137
138
139
140
141
142
143
144
145
146
147
148
149
150
151
152
153
154
155
156
157
158
159
160
161
162
163
164
165
166
167
168
169
170
171
172
173
174
175
176
177
178
179
180
181
182
183
184
185
186
187
188
189
190
191
192
193
194
195
196
197
198
199
200
201
202
203
204
205
206
207
208
209
210
211
212
213
214
215
216
217
218
219
220
221
222
223
224
225
226
227
228
229
230
231
232
233
234
235
236
237
238
239
240
241
242
243
244
245
246
247
248
249
250
251
252
253
254
255
256
257
258
259
260
261
262
263
264
265
266
267
268
269
270
271
272
273
274
275
276
277
278
279
280
281
282
283
284
285
286
287
288
289
290
291
292
293
294
295
296
297
298
299
300
301
302
303
304
305
306
307
308
309
[{"authors":["apeterson"],"categories":null,"content":"Along with Andrew Jaffe, I co-mentored Amy Peterson in 2017-2018. Check her website for more information about her.\nAmy’s MPH capstone presentation Here are some of projects she did with me (taken from her website):\nProjects Worked in collaboration with Mina Ryten’s lab at University College London to analyze Genotype-Tissue Expression (GTEx) project data to explore gene expression variability across brain regions Analyzed GTEx brain samples from recount2 using recount.bwtool with JHPCE, a high-performance computing environment Capstone: Applying Statistical Correction for Brain Tissue Degradation to Gene Expression in Schizophrenia Analyzed postmortem human brain RNA-sequencing data in R using Bioconductor packages with JHPCE Presentations MPH Capstone Presentation “Applying Statistical Correction for Brain Tissue RNA Degradation to Gene Expression Differences in Schizophrenia” (May 4, 2018) slides. Presented “Postmortem Human Brain RNA-seq Analyses with Public and Private Data” at Delta Omega Poster Competition at JHPSH PDF (February 28, 2018). Presented “Expression Profiles in GTEx Data” at the Leekgroup meeting (February 19, 2018) slides. ","date":-62135596800,"expirydate":-62135596800,"kind":"term","lang":"en","lastmod":1683511288,"objectID":"5e4fcb06d40cf08aa50e2cc1c39c17da","permalink":"https://lcolladotor.github.io/authors/apeterson/","publishdate":"0001-01-01T00:00:00Z","relpermalink":"/authors/apeterson/","section":"authors","summary":"Along with Andrew Jaffe, I co-mentored Amy Peterson in 2017-2018. Check her website for more information about her.\nAmy’s MPH capstone presentation Here are some of projects she did with me (taken from her website):","tags":null,"title":"Amy Peterson","type":"authors"},{"authors":["aseyedia"],"categories":null,"content":" ","date":-62135596800,"expirydate":-62135596800,"kind":"term","lang":"en","lastmod":1708978936,"objectID":"4ae85b9d3ea24ec70ade2c2eaac3de73","permalink":"https://lcolladotor.github.io/authors/aseyedia/","publishdate":"0001-01-01T00:00:00Z","relpermalink":"/authors/aseyedia/","section":"authors","summary":" ","tags":null,"title":"Arta Seyedian","type":"authors"},{"authors":["arazmara"],"categories":null,"content":"I mentored Ashkaun Razmara in 2017-2018 while he was visiting the Johns Hopkins Bloomberg School of Public Health. Check his website for more information about him.\nAshkaun is the lead author of the recount-brain project which you can read in more detail at here.\n","date":-62135596800,"expirydate":-62135596800,"kind":"term","lang":"en","lastmod":1683511288,"objectID":"32b2f3061d96088be0e97ec35bf0d0ef","permalink":"https://lcolladotor.github.io/authors/arazmara/","publishdate":"0001-01-01T00:00:00Z","relpermalink":"/authors/arazmara/","section":"authors","summary":"I mentored Ashkaun Razmara in 2017-2018 while he was visiting the Johns Hopkins Bloomberg School of Public Health. Check his website for more information about him.\nAshkaun is the lead author of the recount-brain project which you can read in more detail at here.","tags":null,"title":"Ashkaun Razmara","type":"authors"},{"authors":["bpardo"],"categories":null,"content":"Our paper describing our package #spatialLIBD is finally out! 🎉🎉🎉\nspatialLIBD is an #rstats / @Bioconductor package to visualize spatial transcriptomics data.\n⁰\nThis is especially exciting for me as it is my first paper as a first author 🦑.https://t.co/COW013x4GA\n1/9 pic.twitter.com/xevIUg3IsA\n— Brenda Pardo (@PardoBree) April 30, 2021 Check her presentation summarizing her experience in my team.\n","date":-62135596800,"expirydate":-62135596800,"kind":"term","lang":"en","lastmod":1683511288,"objectID":"03f4aa09deba1b6eef0cabda141bb5e3","permalink":"https://lcolladotor.github.io/authors/bpardo/","publishdate":"0001-01-01T00:00:00Z","relpermalink":"/authors/bpardo/","section":"authors","summary":"Our paper describing our package #spatialLIBD is finally out! 🎉🎉🎉\nspatialLIBD is an #rstats / @Bioconductor package to visualize spatial transcriptomics data.\n⁰\nThis is especially exciting for me as it is my first paper as a first author 🦑.","tags":null,"title":"Brenda Pardo","type":"authors"},{"authors":["cyntsc"],"categories":null,"content":" ","date":-62135596800,"expirydate":-62135596800,"kind":"term","lang":"en","lastmod":1731539418,"objectID":"18ea15e0e829b17542401481935948f0","permalink":"https://lcolladotor.github.io/authors/cyntsc/","publishdate":"0001-01-01T00:00:00Z","relpermalink":"/authors/cyntsc/","section":"authors","summary":" ","tags":null,"title":"Cynthia S. Cardinault","type":"authors"},{"authors":["daianna21"],"categories":null,"content":" Talking about Differential Expression Analysis at @lcgunam. Thank you @lcolladotor @LieberInstitute pic.twitter.com/smZc8iZ2qx\n— Daianna (@daianna_glez) February 4, 2023 2 years of many scientific experiences and acquired knowledge, professional growth, academic learnings, and personal lessons at the @LieberInstitute. Thank you for all you and your team taught me and all the opportunities you gave me @lcolladotor! 💻👏🏼https://t.co/DKFFhhpleY pic.twitter.com/5aPZ1h804y\n— Daianna (@daianna_glez) July 9, 2024 ","date":-62135596800,"expirydate":-62135596800,"kind":"term","lang":"en","lastmod":1731539418,"objectID":"d5c1ca02aad6fe61bdd6c5ee934b8778","permalink":"https://lcolladotor.github.io/authors/daianna21/","publishdate":"0001-01-01T00:00:00Z","relpermalink":"/authors/daianna21/","section":"authors","summary":"Talking about Differential Expression Analysis at @lcgunam. Thank you @lcolladotor @LieberInstitute pic.twitter.com/smZc8iZ2qx\n— Daianna (@daianna_glez) February 4, 2023 2 years of many scientific experiences and acquired knowledge, professional growth, academic learnings, and personal lessons at the @LieberInstitute.","tags":null,"title":"Daianna Gonzalez-Padilla","type":"authors"},{"authors":["hediatnani"],"categories":null,"content":" ","date":-62135596800,"expirydate":-62135596800,"kind":"term","lang":"en","lastmod":1723567040,"objectID":"d8b8279429eb68b8d3bfc8e337c37910","permalink":"https://lcolladotor.github.io/authors/hediatnani/","publishdate":"0001-01-01T00:00:00Z","relpermalink":"/authors/hediatnani/","section":"authors","summary":" ","tags":null,"title":"Hedia Tnani","type":"authors"},{"authors":["joshstolz"],"categories":null,"content":" It was a great time presenting qsvaR at #Bioc2022. It\u0026#39;s been a great time being a part of the bioconductor community and I\u0026#39;m glad to have contributed. I recognize I ran short on time so feel free to ask any questions here I didn\u0026#39;t get to. #Rstats #genomics pic.twitter.com/nKUOzCigwZ\n— Joshua Stolz (@JoshuaMStolz) July 28, 2022 ","date":-62135596800,"expirydate":-62135596800,"kind":"term","lang":"en","lastmod":1683522035,"objectID":"b99d74063e8f2f28f37f02e7aebba89b","permalink":"https://lcolladotor.github.io/authors/joshstolz/","publishdate":"0001-01-01T00:00:00Z","relpermalink":"/authors/joshstolz/","section":"authors","summary":"It was a great time presenting qsvaR at #Bioc2022. It's been a great time being a part of the bioconductor community and I'm glad to have contributed. I recognize I ran short on time so feel free to ask any questions here I didn't get to.","tags":null,"title":"Joshua M. Stolz","type":"authors"},{"authors":["admin"],"categories":null,"content":" At the Lieber Institute for Brain Development (LIBD), I lead the R/Bioconductor-powered Team Data Science group. I am also an Assistant Professor in the Department of Biostastics at the Johns Hopkins Bloomberg School of Public Health. Additionally, I am interested in outreach activities as a board member of the Community of Bioinformatics Software Developers.\nAs a quick background, I graduated from the Undergraduate Program on Genomic Sciences from the National Autonomous University of Mexico (UNAM) in 2009 and worked for two years at Winter Genomics analyzing high-throughput sequencing data. I then got a PhD in 2016 from the Department of Biostatistics at Johns Hopkins Bloomberg School of Public Health thanks to a CONACyT scholarship. There I worked with Jeff Leek and Andrew Jaffe in developing derfinder and recount. I then worked ~ 4 years as a Staff Scientist and Research Scientist in Andrew Jaffe’s lab on a variety of data analysis projects. I became a principal investigator in September 2020.\nEvery day I use R and Bioconductor, and on some days I write R packages. Occasionally I write blog posts about them and other tools. I’m a co-founder of the LIBD rstats club and the CDSB community of R and Bioconductor developers in Mexico and Latin America, that we described at the R Consortium website. In the past, I also served on the Bioconductor Community Advisory Board and the advisory board for rOpenSci’s Statistical Software Peer Review.\n","date":-62135596800,"expirydate":-62135596800,"kind":"term","lang":"en","lastmod":1731538890,"objectID":"2525497d367e79493fd32b198b28f040","permalink":"https://lcolladotor.github.io/authors/admin/","publishdate":"0001-01-01T00:00:00Z","relpermalink":"/authors/admin/","section":"authors","summary":"At the Lieber Institute for Brain Development (LIBD), I lead the R/Bioconductor-powered Team Data Science group. I am also an Assistant Professor in the Department of Biostastics at the Johns Hopkins Bloomberg School of Public Health.","tags":null,"title":"Leonardo Collado-Torres","type":"authors"},{"authors":["lahuuki"],"categories":null,"content":" Excited to share my first 🥇 first-author manuscript: \u0026#34;Data-driven Identification of Total RNA Expression Genes (TREGs) for Estimation of RNA Abundance in Heterogeneous Cell Types\u0026#34; 👩🔬 @LieberInstitute #scitwitter\nNow a @biorxivpreprint ! 🎉\n📰 https://t.co/OJuAWndW51 pic.twitter.com/VZ8xzJpcyv\n— Louise Huuki-Myers (@lahuuki) May 3, 2022 Hot of the pre-print press! 🔥 Our latest work #spatialDLPFC pairs #snRNAseq and #Visium spatial transcriptomic data in the human #DLPFC building a neuroanatomical atlas of this critical brain region 🧠@LieberInstitute @10xGenomics #scitwitter\n📰 https://t.co/NJWJ1mwB9J pic.twitter.com/l8W154XZ50\n— Louise Huuki-Myers (@lahuuki) February 17, 2023 ","date":-62135596800,"expirydate":-62135596800,"kind":"term","lang":"en","lastmod":1731539418,"objectID":"c7275c51190b452c419975da4d0bc9c4","permalink":"https://lcolladotor.github.io/authors/lahuuki/","publishdate":"0001-01-01T00:00:00Z","relpermalink":"/authors/lahuuki/","section":"authors","summary":"Excited to share my first 🥇 first-author manuscript: \"Data-driven Identification of Total RNA Expression Genes (TREGs) for Estimation of RNA Abundance in Heterogeneous Cell Types\" 👩🔬 @LieberInstitute #scitwitter\nNow a @biorxivpreprint !","tags":null,"title":"Louise A. Huuki-Myers","type":"authors"},{"authors":["manishabarse"],"categories":null,"content":" ","date":-62135596800,"expirydate":-62135596800,"kind":"term","lang":"en","lastmod":1731539418,"objectID":"af0ac5f4e3cf59770bb4b5fcd2b2b8de","permalink":"https://lcolladotor.github.io/authors/manishabarse/","publishdate":"0001-01-01T00:00:00Z","relpermalink":"/authors/manishabarse/","section":"authors","summary":" ","tags":null,"title":"Manisha Barse","type":"authors"},{"authors":["Melii99"],"categories":null,"content":" From Melissa:\nI am an undergraduate student in Genomic Sciences program at LCG-UNAM. My research interests lean towards in developmental biology, transcriptomics, epigenetics and ML. Currently I´m an apprentice and a new member of Leonardo Collado’s laboratory at the Lieber Institute for Brain Development.\n","date":-62135596800,"expirydate":-62135596800,"kind":"term","lang":"en","lastmod":1731539418,"objectID":"7716fc2ffa60412da9c47d737212a664","permalink":"https://lcolladotor.github.io/authors/melii99/","publishdate":"0001-01-01T00:00:00Z","relpermalink":"/authors/melii99/","section":"authors","summary":"From Melissa:\nI am an undergraduate student in Genomic Sciences program at LCG-UNAM. My research interests lean towards in developmental biology, transcriptomics, epigenetics and ML. Currently I´m an apprentice and a new member of Leonardo Collado’s laboratory at the Lieber Institute for Brain Development.","tags":null,"title":"Melissa Mayén-Quiroz","type":"authors"},{"authors":["nickeagles"],"categories":null,"content":" Congrats Nick https://t.co/O3u5XRPXy2 for your @biorxivpreprint first pre-print! 🙌🏽\nSPEAQeasy is our @nextflowio implementation of the #RNAseq processing pipeline that produces @Bioconductor-friendly #rstats objects that we use at @LieberInstitute\n📜 https://t.co/zKuBRtBCmY pic.twitter.com/F83fXI90eP\n— 🇲🇽 Leonardo Collado-Torres (@lcolladotor) December 12, 2020 We are excited to share with you our latest @biorxivpreprint: BiocMAP: A @Bioconductor-friendly, GPU-Accelerated Pipeline for Bisulfite-Sequencing Data #WGBS\nCongrats for the excellent work independently leading this project Nick https://t.co/O3u5XRPXy2!https://t.co/Td65Ns6Tp7 pic.twitter.com/HMjaU6kUl8\n— 🇲🇽 Leonardo Collado-Torres (@lcolladotor) April 22, 2022 I\u0026#39;m thrilled to share with you that #visiumStitched led by @nick-eagles.bsky.social has now been published Our #RStats / @bioconductor.bsky.social 📦 provides a framework for stitching together multiple #Visium @10xgenomics.bsky.social capture areas together\n#AcademicSky\ndoi.org/10.1186/s128…\n[image or embed]\n— 🇲🇽 Leonardo Collado-Torres (@lcolladotor.bsky.social) November 18, 2024 at 11:32 AM\n","date":-62135596800,"expirydate":-62135596800,"kind":"term","lang":"en","lastmod":1731949337,"objectID":"f151c49dac9f597b44c7e8981f3a7417","permalink":"https://lcolladotor.github.io/authors/nickeagles/","publishdate":"0001-01-01T00:00:00Z","relpermalink":"/authors/nickeagles/","section":"authors","summary":"Congrats Nick https://t.co/O3u5XRPXy2 for your @biorxivpreprint first pre-print! 🙌🏽\nSPEAQeasy is our @nextflowio implementation of the #RNAseq processing pipeline that produces @Bioconductor-friendly #rstats objects that we use at @LieberInstitute","tags":null,"title":"Nicholas J. Eagles","type":"authors"},{"authors":["rgarcia"],"categories":null,"content":" From Renee:\nI am a young mexican scientist discovering her path in science and a bioinformatician in training. I am currently working with bulk and snRNA-seq data from the brain at LIBD. I’m also training for a half-marathon and enjoying eating accordingly.\n","date":-62135596800,"expirydate":-62135596800,"kind":"term","lang":"en","lastmod":1696390229,"objectID":"62a49725f99e124c68e49ef77bec4c51","permalink":"https://lcolladotor.github.io/authors/reneegf/","publishdate":"0001-01-01T00:00:00Z","relpermalink":"/authors/reneegf/","section":"authors","summary":"From Renee:\nI am a young mexican scientist discovering her path in science and a bioinformatician in training. I am currently working with bulk and snRNA-seq data from the brain at LIBD.","tags":null,"title":"Renee Garcia-Flores","type":"authors"},{"authors":["team"],"categories":null,"content":" At the Lieber Institute for Brain Development (LIBD), as part of the Translational Neuroscience Division, our group works on understanding the roots and signatures of disease (particularly psychiatric disorders) by zooming in across dimensions of gene activity. We achieve this by studying gene expression at all expression feature levels (genes, exons, exon-exon junctions, and un-annotated regions) and by using different gene expression measurement technologies (bulk RNA-seq, single cell/nucleus RNA-seq, and spatial transcriptomics) that provide finer biological resolution and localization of gene expression. We work closely with collaborators from LIBD as well as from Johns Hopkins University (JHU), University of Cambridge, and other institutions, which reflects the cross-disciplinary approach and diversity in expertise needed to further advance our understanding of high throughput biology.\nIn order to provide a supportive and stimulating research environment at LIBD, our group provides Data Science guidance sessions open to any LIBD staff member and we organize the LIBD rstats club, among other initiatives. Our documentation book website contains more details for on boarding, how to ask for help, bootcamps, writing papers, authorship, configuration files, and much more.\nCheck out the content we share We constantly create new content to share what we are learning or working on, which you might be interested in. In particular, we:\nrun the LIBD rstats club: rstats club schedule discuss papers and software in our team meetings: team meeting schedule Join the team If you are interested in joining the R/Bioconductor-powered Team Data Science group, please check our open positions at the LIBD career opportunities website. You might be interested in checking our anonymous team survey results, which highlights some strengths but also some weaknesses and areas we can improve.\nIf we don’t have any open positions, please reach out to Leonardo with your CV, GitHub/GitLab/etc profile with open-source software, and a short description of why you are interested in our team.\n","date":-62135596800,"expirydate":-62135596800,"kind":"term","lang":"en","lastmod":1731539418,"objectID":"3727ee9a01674e6999f24524b05a5897","permalink":"https://lcolladotor.github.io/authors/team/","publishdate":"0001-01-01T00:00:00Z","relpermalink":"/authors/team/","section":"authors","summary":"At the Lieber Institute for Brain Development (LIBD), as part of the Translational Neuroscience Division, our group works on understanding the roots and signatures of disease (particularly psychiatric disorders) by zooming in across dimensions of gene activity.","tags":null,"title":"Translational Neuroscience Division, Data Science I","type":"authors"},{"authors":[],"categories":["rstats","LIBD"],"content":"Two weeks ago I finished testing Posit Connect as a replacement to shinyapps.io. At the end of the trial period, I presented my conclusions during a LIBD rstats club session. Here you can read the detailed notes and watch the resulting video:\nThe video and notes dive more into the technical details and I also performed some live tests. Below I summarize the main points from our use case and solutions we have experience with.\nOur use case Overall, my team and colleagues at LIBD are in a position where we have:\nOver 75 iSEE and spatialLIBD web apps powered by shiny and hosted on shinyapps.io. These apps have been deployed by 14 different people so far. That is, we have been able to teach new members or students how to deploy apps: anyone can do so with a bit of training. Our apps are typically shared publicly, so we don’t really need password-controlled access. We don’t share URLs for studies under development assuming that no one will correctly guess the URLs. Our data is stored in SummarizedExperiment, SingleCellExperiment, or SpatialExperiment objects. The single cell and spatially-resolved transcriptomics data typically involves over 50,000 cells or Visium spots across 20,000 or so genes. Some larger studies are over 100,000 or 200,000 cells/spots. The cells/spots are the columns and the genes are the rows in these large matrices of expression data. Many cells/spots don’t have expression data, so the matrices are sparse. For more on these types of objects check the video below. For spatially-resolved transcriptomics data, SpatialExperiment objects also contain images per sample (defined as a Visium capture area). These are typically lowres images that are maximum 600 x 600 pixels. One of our largest studies has 120 samples. There are other images that we typically remove from the objects, such as this case which saved 3.29 GB of memory by dropping non-essential images in a study with 36 samples. The initial SpatialExperiment object used 8.81 GB in memory for this study. The expression matrices are typically saved as dgCMatrix objects from the Matrix package. These are great for storing sparse data if you want it all in memory. However, for our larger studies, we typically just keep one matrix that has the library-size normalized counts (called logcounts) and drop the un-normalized counts. In the same dataset with 36 samples, this meant another 2.6 GB saved in memory as shown here. This resulted in a reduced SpatialExperiment object of 2.92 GB in memory for this study containing only the logcounts normalized gene expression data and the lowres images. For larger studies, we can use HD5Array objects to store the expression data on disk and only load the data in memory when needed. For a dataset with 120 samples, this results in a 505.20 Mb SpatialExperiment object in memory that has the counts, lowres images, 36,601 genes, and 599,034 spots as shown here. The files on disk use about 1.5 GB of space: 1.4 GB for the .h5 file as noted here. Actually, for this study, we have another SpatialExperiment object with logcounts and counts, no images, 28,965 genes, and 535,248 spots that uses 154.04 Mb in memory as noted here. However, the files on disk grow to use 13 GB of disk space for the .h5 file as shown here. I believe that’s because the logcounts which have decimal numbers take much more disk space to store them. This same object as a sparse memory object and with the lowres images added used 10.69 GB of memory as noted here. HDF5Array is awesome for saving memory, but it can take up a lot of disk space. It’s a great resource developed by Hervé Pagès from Bioconductor’s core team. For more on HDF5Array and compressed data, check this video: We have observed that iSEE and spatialLIBD need more memory than just the one needed for loading the object as reported on the memory usage graphs provided by shinyapps.io. That’s because of some internal operations, and while both packages try to minimize memory duplication, it’s best to have more memory than twice the object size to prevent the apps from crashing: if they are unreliable, people won’t use them. In practice, we try to deploy objects that use up to 3 GB of memory when using the 8 GB memory instances on shinyapps.io. Use case summary Overall we have been able to use shinyapps.io for studies with R objects that use up to 3 GB of memory with sparse memory dgCMatrix objects for storing the logcounts normalized expression data. In the case of spatially-resolved transcriptomics projects, we only include the lowres images. These objects can also be uploaded within the 3 to 5 GB file size limit as noted in the official shinyapps documentation. However, we have datasets where this is no longer possible. You either need more memory or the ability to save data in files larger than 5 GB.\nDeployment options We have considered the following options for deploying our apps:\nAWS-hosted shiny-server You choose how much disk space and memory you need on a given AWS instance …","date":1741910400,"expirydate":-62135596800,"kind":"page","lang":"en","lastmod":1741966118,"objectID":"14c8f020ad31123452a9bc37048b3d9f","permalink":"https://lcolladotor.github.io/2025/03/14/initial-impressions-from-testing-posit-connect/","publishdate":"2025-03-14T00:00:00Z","relpermalink":"/2025/03/14/initial-impressions-from-testing-posit-connect/","section":"post","summary":"Two weeks ago I finished testing Posit Connect as a replacement to shinyapps.io. At the end of the trial period, I presented my conclusions during a LIBD rstats club session. Here you can read the detailed notes and watch the resulting video:","tags":["shiny","spatialLIBD","iSEE","Posit Connect","shinyapps.io"],"title":"Initial impressions from testing Posit Connect","type":"post"},{"authors":[],"categories":["UNAM"],"content":" Notes from a second semester introductory class to the world of omics research techniques at LCG-UNAM. That is, my undergrad alma mater. Thank you for the invitation! Valentina Arias Ojeda is as teaching assistant for the class “Omics Research Techniques”, taught by Dr. Constance Auvynet at LCG-UNAM. They invited me to teach a class on single cell RNA-seq and spatially-resolved transcriptomics. Valentina introduced me and then I mentioned a bit of my teaching history, starting from my first teaching experience where I made a website available in both English and Spanish.\nI decided to teach today’s class as a collective “Data Science guidance session”. However, unlike a regular DSgs, we first needed to come up with a list of questions or concepts that they wanted to learn more about. Here I used a technique I learned as a teaching assistant for the 140.620 series on Statistical Methods in Public Health at JHU. That is, write on the board the questions, then try to group them up into different categories. Our full list of questions was:\nRNA-seq What is the difference between microarrays and RNA-seq? What is RNA-seq? How do we deal with ribosomal RNAs in RNA-seq? How do we deal with noise in RNA-seq? How do we define noise? How does RNA-seq deal with RNA secondary structures? Single cell RNA-seq What is scRNA-seq? What is scRNA-seq useful for? Which are the main sequencing technologies? What is ATAC-seq? What is insitu seq? Spatially resolved transcriptomics What is spatially resolved transcriptomics? What is the difference between spatially resolved transcriptomics and scRNA-seq? How can we integrate RNA-seq and spatially resolved transcriptomics? What are the physics behind spatially resolved transcriptomics? Data analysis Why do we use R for omics data analysis? How do we analyze RNA-seq data? How do we analyze scRNA-seq data? How do we analyze spatially resolved transcriptomics data? How much computational power do we need for spatial omics data analysis? How do we integrate RNA-seq and spatially resolved transcriptomics data? RNA-seq I used this slide with an image from Gandal et al DOI 10.1016/j.biopsych.2020.06.005 that shows many types of RNA molecules. Many are mostly interested in mRNA: messenger RNA. Though other RNA molecules can be of interest, such as microRNAs.\nFor microarrays, I explained how they are probe-based assays where a company designs the probes, prints them on a glass screen, and how the data is generated through high resolution images (photos) of the glass screen. To do this, you have to know the gene annotation (where genes are located in the genome) in order to design the probes. Microarrays are cheaper than RNA-seq and have been used a lot for DNA genotyping, where we are interested in a set of 2.5 million or so locations in the genome that commonly vary between individuals.\nRNA-seq really came to be popular or well, possible, with the advent of next generation sequencing. The idea is that you can sequence the RNA molecules in a sample and then align the sequences to the genome to know where they came from. This is more expensive than microarrays but it has the advantage that you don’t need to know the gene annotation beforehand. This is because you can align the sequences to the genome and then count how many sequences align to each gene. You can also study isoforms (transcripts), instead of genes. A quick Google search led me here as I wanted to show them an illustration of a gene with multiple transcripts, some of them with very small differences between them. We also looked at Gencode’s release history to highlight that the gene annotation is not static and frequently updated.\nFor a quick intro to next generation sequencing or high-throughput sequencing (these were synonyms in 2006 to 2011 or so), I went back to a course I taught for UNAM PhD students shortly after finishing my undergrad. From https://lcolladotor.github.io/courses/PDCB-HTS.html, we looked at the slide deck for “2. Understanding the technology”. Particularly slides 39 to 42 where I briefly explained Illumina short read sequencing.\nIn relation to ribosomal RNAs, I explained the two most common RNA-seq protocols: polyA+ and ribo-depletion (RiboZeroGold). I used a preprint we wrote in 2024 where Figure 1B shows the two RNA-seq library types but also the different RNA extraction protocols (often something people ignore).\nFigure 1D highlights how different the data using principal components (PC1 separates library type, PC2 separates RNA extractions), and Figure 1E shows within a given RNA extraction, how genes are differentially quantified by the two library types.\nFor noise in RNA-seq, we looked at my derfinder PhD paper. Figure 1 actually is a reminder of how transcripts can have very small differences between them. Figure 2 has coverage curves for RNA-seq data. We used derfinder when we studied human brain expression changes across age groups including prenatal samples DOI 10.1038/nn.3898. Through that work we …","date":1741305600,"expirydate":-62135596800,"kind":"page","lang":"en","lastmod":1741385973,"objectID":"a13ca9dd4c636d1ca60f8403c27d990d","permalink":"https://lcolladotor.github.io/2025/03/07/teaching-omics-methods-to-lcg-unam-students/","publishdate":"2025-03-07T00:00:00Z","relpermalink":"/2025/03/07/teaching-omics-methods-to-lcg-unam-students/","section":"post","summary":"Notes from a second semester introductory class to the world of omics research techniques at LCG-UNAM. That is, my undergrad alma mater. Thank you for the invitation! Valentina Arias Ojeda is as teaching assistant for the class “Omics Research Techniques”, taught by Dr.","tags":["LCG","Genomics","Teaching"],"title":"Teaching omics methods to LCG-UNAM students","type":"post"},{"authors":["S García-Ruiz","D Zhang","E K Gustavsson","G Rocamora-Perez","M Grant-Peters","A Fairbrother-Browne","R H Reynolds","J W Brenton","A L Gil-Martínez","Z Chen","D C Rio","J A Botia","S Guelfi","Leonardo Collado-Torres","M Ryten"],"categories":[],"content":"New in @NatureComms: I\u0026#39;m thrilled to share with you our latest work that applies #srRNAseq to understand splicing accuracy across human introns, tissues and in the context of ageing and neurodegeneration https://t.co/KapUzy4OQP\n— SoniaRuiz (@sonigruiz) January 27, 2025 Congratulations to @soniagr.bsky.social, rytenlab.com team, et al for this project re-analyzing #GTEx human gene expression data uniformly re-processed with #recount3 It was a pleasure working with Sonia G \u0026amp; Mina Ryten\ndoi.org/10.1038/s414…\[email protected] @lieberinstitute.bsky.social\n[image or embed]\n— 🇲🇽 Leonardo Collado-Torres (@lcolladotor.bsky.social) January 28, 2025 at 3:54 PM\n","date":1737936000,"expirydate":-62135596800,"kind":"page","lang":"en","lastmod":1738098870,"objectID":"72b44669d646dad163cbf116c41de3d4","permalink":"https://lcolladotor.github.io/publication/2025_01_splicing_noise/","publishdate":"2025-01-27T00:00:00Z","relpermalink":"/publication/2025_01_splicing_noise/","section":"publication","summary":"Alternative splicing impacts most multi-exonic human genes. Inaccuracies during this process may have an important role in ageing and disease. Here, we investigate splicing accuracy using RNA-sequencing data from {\\textgreater}14k control samples and 40 human body sites, focusing on split reads partially mapping to known transcripts in annotation. We show that splicing inaccuracies occur at different rates across introns and tissues and are affected by the abundance of core components of the spliceosome assembly and its regulators. We find that age is positively correlated with a global decline in splicing fidelity, mostly affecting genes implicated in neurodegenerative diseases. We find support for the latter by observing a genome-wide increase in splicing inaccuracies in samples affected with Alzheimer’s disease as compared to neurologically normal individuals. In this work, we provide an in-depth characterisation of splicing accuracy, with implications for our understanding of the role of inaccuracies in ageing and neurodegenerative disorders","tags":["recount3","CHESS-BRAIN"],"title":"Splicing accuracy varies across human introns, tissues, age and disease","type":"publication"},{"authors":["Leonardo Collado-Torres"],"categories":null,"content":" ","date":1733356800,"expirydate":-62135596800,"kind":"page","lang":"en","lastmod":1733941596,"objectID":"79e9df52b5b7f6f589c58ff425f19f99","permalink":"https://lcolladotor.github.io/talk/spatialbiology2024/","publishdate":"2024-12-05T00:00:00Z","relpermalink":"/talk/spatialbiology2024/","section":"talk","summary":"Spatial Biology West Coast US 2024","tags":["spatial","HumanPilot","spatialLIBD","Bioconductor","VisiumHD"],"title":"Lessons From Working On The Edge Of Human Brain Spatially-Resolved Transcriptomics","type":"talk"},{"authors":["Nicholas J. Eagles","Svitlana V. Bach","Madhavi Tippani","Prashanthi Ravichandran","Yufeng Du","Ryan A. Miller","Thomas M. Hyde","Stephanie C. Page","Keri Martinowich","Leonardo Collado-Torres"],"categories":[],"content":"Is your tissue larger than a @10xGenomics Visium capture area? If you need to stitch together the images but also the gene expression data, check our new preprint describing #visiumStitched\nWe also shared example postmortem human brain data (3 samples)https://t.co/sYMH2V10JE pic.twitter.com/N3owaWlLPl\n— 🇲🇽 Leonardo Collado-Torres (@lcolladotor) August 12, 2024 ","date":1731456000,"expirydate":-62135596800,"kind":"page","lang":"en","lastmod":1731606017,"objectID":"4d224066469a72e700bf7650789a7fae","permalink":"https://lcolladotor.github.io/publication/2024_11_visiumstitched/","publishdate":"2024-11-13T00:00:00Z","relpermalink":"/publication/2024_11_visiumstitched/","section":"publication","summary":"**Background** Visium is a widely-used spatially-resolved transcriptomics assay available from 10x Genomics. Standard Visium capture areas (6.5mm by 6.5mm) limit the survey of larger tissue structures, but combining overlapping images and associated gene expression data allow for more complex study designs. Current software can handle nested or partial image overlaps, but is designed for merging up to two capture areas, and cannot account for some technical scenarios related to capture area alignment.\n**Results** We generated Visium data from a postmortem human tissue sample such that two capture areas were partially overlapping and a third one was adjacent. We developed the R/Bioconductor package visiumStitched, which facilitates stitching the images together with Fiji (ImageJ), and constructing SpatialExperiment R objects with the stitched images and gene expression data. visiumStitched constructs an artificial hexagonal array grid which allows seamless downstream analyses such as spatially-aware clustering without discarding data from overlapping spots. Data stitched with visiumStitched can then be interactively visualized with spatialLIBD.\n**Conclusions** visiumStitched provides a simple, but flexible framework to handle various multi-capture area study design scenarios. Specifically, it resolves a data processing step without disrupting analysis workflows and without discarding data from overlapping spots. visiumStitched relies on affine transformations by Fiji, which have limitations and are less accurate when aligning against an atlas or other situations. visiumStitched provides an easy-to-use solution which expands possibilities for designing multi-capture area study designs.","tags":["spatial","spatialLIBD"],"title":"Integrating gene expression and imaging data across Visium capture areas with visiumStitched","type":"publication"},{"authors":[],"categories":["UNAM"],"content":"I recently gave a remote seminar presentation for the Applications of Genomics 2024-2025 course organized by Esperanza Martínez Romero and Alejandra Zayas Del Moral. The idea was to talk about my career and showcase some recent research work from my team.\nA week ago I had the privilege to present to #LCG-UNAM students as part of the Aplicaciones de la Genómica course by Esperanza Martínez and @alezayas.bsky.social www.youtube.com/watch?v=a_Ip… (in Spanish 🇲🇽) 🛝 speakerdeck.com/lcolladotor/…\n#DeconvoBuddies @bioconductor.bsky.social #RStats\n[image or embed]\n— 🇲🇽 Leonardo Collado-Torres (@lcolladotor.bsky.social) November 7, 2024 at 11:07 AM\nBut I also wanted to take the opportunity to talk about the importance of community building and relying on the support from your communities as you advance in your career. I’m from the third class of LCG-UNAM undergraduate program on Genomic Sciences from the National Autonomous University of Mexico (UNAM) and graduated in 2009 (see my timeline blog post for more details). That means that we didn’t have as many people to look up to as you do now. Here’s a short extract of how I relayed some of this to the students at the end of my seminar.\nNote that if you don’t speak Spanish, YouTube can auto-translate the captions to your language of choice ^^.\nLCG(EJ)-UNAM network Let’s say that you are a current student and want to tap into the LCG(EJ)-UNAM network. Well, the LCG-UNAM and LCG-EJ-UNAM network is actually not that easy to find 😔.\nNote that the two sibling undergrad programs are actually run by different people, both from UNAM. I personally consider them to be part of the same group (particularly from an international lens) as I think that diving them is not helpful. Though I understand that each program has specific areas they want to emphasize, different funding issues, and different challenges they face.\nEmails Ok, so maybe one way to get in touch with others is via email. For LCG-UNAM there’s a mailing list for everyone, but that only includes @lcg.unam.mx emails which many alumni don’t check/use anymore. For LCG-EJ-UNAM I’ve been told that there’s no mailing list.\nFor each class in LCG-UNAM there’s also another mailing list, but well, they have the same issue of only including @lcg.unam.mx emails.\nDuring the lead to LCG20 celebrations (20 year anniversary of LCG-UNAM), a Google Sheet was spread around where people wrote down their name, class, and email. So I’ve also used that email list (many of which are @gmail.com accounts) too. There are 130 emails listed here (some with typos!).\nFacebook LCG-UNAM alumni have set up a private Facebook group. It currently has 355 members. I see that some members are LCG-EJ-UNAM alumni, so I believe that both programs are welcome there. This is probably the one resource most people use when trying to ask for help or share opportunities. However, many don’t use Facebook anymore, so I wonder how many of the members are actually active. It does have the benefit of being a private group, unlike other social media platforms. So I think that this Facebook group will continue to be one of the main ways to get in touch with LCG(EJ)-UNAM alumni.\nSlack As you might know, I’m a big fan of Slack for communicating for work. Yet, as far as I know, there’s no LCG(EJ)-UNAM Slack workspace. However, as co-founder of the Community of Bioinformatics Software Developers, I’ve been encouraging people to join us at the CDSB Slack workspace.\nOne way I do so is by asking students from the LCG and LCG-EJ courses I have taught to join the CDSB Slack where I set up a channel for the course and communicate with them through it. Then once the course is over, they are part of the CDSB Slack and can network with others there. This Slack workspace isn’t as active as I would like it to be, but well, it’s a start. It currently has 396 members on the #general channel.\nX/Twitter and now Bluesky During my courses I have also encouraged students to create a Twitter account to be able to network with other scientists at large, get their name out there, and meet people who can help them along the way. Maybe indirectly, just by sharing interesting resources. Maybe directly, by asking each other questions and then possibly meeting up in person later on. Some LCG-UNAM alumni historically were very active on Twitter.\nBluesky has taken off However, X/Twitter isn’t what it used to be. In recent weeks, the open-source alternative Bluesky has taken off. In 2023 you had to get a code to join, which made it really unfeasible to get students to join or the community at large. But things are different now at the end of 2024 and Bluesky has really taken off lately. One of the reasons is starter packs, which allow anyone to recommend up to 150 accounts that others might want to follow.\nOne personal reason why I had still being using X/Twitter was because I felt that my community of genomics scientists trained in Mexico, working in Mexico, or helping train Mexicans wasn’t represented …","date":1731283200,"expirydate":-62135596800,"kind":"page","lang":"en","lastmod":1731513560,"objectID":"48a2b204b9b08349661a53fe04da8c80","permalink":"https://lcolladotor.github.io/2024/11/11/genomics-scientists-from-and-in-mexico-community-building/","publishdate":"2024-11-11T00:00:00Z","relpermalink":"/2024/11/11/genomics-scientists-from-and-in-mexico-community-building/","section":"post","summary":"I recently gave a remote seminar presentation for the Applications of Genomics 2024-2025 course organized by Esperanza Martínez Romero and Alejandra Zayas Del Moral. The idea was to talk about my career and showcase some recent research work from my team.","tags":["Diversity","LCG","Sponsorship","Genomics"],"title":"Genomics scientists from and in Mexico community building","type":"post"},{"authors":["Daianna Gonzalez-Padilla","Nicholas J. Eagles","Marisol Cano","Andrew E. Jaffe","Kristen R. Maynard","Dana B. Hancock","James T. Handa","Keri Martinowich","Leonardo Collado-Torres"],"categories":[],"content":"So excited to share a new preprint 🎉📄 for a transcriptomic study at @LieberInstitute where we compared the effects of cigarette smoke 🚬 vs. nicotine 💉 exposure on the developing and adult mouse 🐁 brain 🧠 and blood 🩸.\n🔗https://t.co/6ZQ4ICUayI Check thread for more 🧵👇🏼 pic.twitter.com/ajXtC6c2ag\n— Daianna (@daianna_glez) November 9, 2024 ","date":1730764800,"expirydate":-62135596800,"kind":"page","lang":"en","lastmod":1731265214,"objectID":"b67ad030d03b3a567b2a937de681feed","permalink":"https://lcolladotor.github.io/publication/preprint_smokingmouse/","publishdate":"2024-11-05T00:00:00Z","relpermalink":"/publication/preprint_smokingmouse/","section":"publication","summary":"Maternal smoking during pregnancy (MSDP) is associated with significant cognitive and behavioral effects on offspring. While neurodevelopmental outcomes have been studied for prenatal exposure to nicotine, the main psychoactive component of cigarette smoke, its contribution to MSDP effects has never been explored. Comparing the effects of these substances on molecular signaling in the prenatal and adult brain may provide insights into nicotinic and broader tobacco consequences that are developmental-stage specific or age-independent. Pregnant mice were administered nicotine or exposed to chronic cigarette smoke, and RNA-sequencing was performed on frontal cortices of postnatal day 0 pups born to these mice, as well as on frontal cortices and blood of the adult dams. We identified 1,010 and 4,165 differentially expressed genes (DEGs) in nicotine and smoking-exposed pup brains, respectively (FDR\u003c0.05, Ns = 19 nicotine-exposed vs 23 vehicle-exposed; 46 smoking-exposed vs 49 controls). Prenatal nicotine exposure (PNE) alone was related to dopaminergic synapses and long-term synaptic depression, whereas MSDP was associated with the SNARE complex and vesicle transport. Both substances affected SMN-Sm protein complexes and postsynaptic endosomes. Analyses at the transcript, exon, and exon-exon junction levels supported gene level results and revealed additional smoking-affected processes. No DEGs at FDR\u003c0.05 were found in adult mouse brain for any substance (12 nicotine-administered vs 11 vehicle-administered; 12 smoking-exposed vs 12 controls), nor in adult blood (12 smoking-exposed vs 12 controls), and only 3% and 6.41% of the DEGs in smoking-exposed pup brain replicated in smoking-exposed blood and human prenatal brain, respectively. Together, these results demonstrate variable but overlapping molecular effects of PNE and MSDP on the developing brain, and attenuated effects of both smoking and nicotine on adult versus fetal brain.","tags":[],"title":"Molecular impact of nicotine and smoking exposure on the developing and adult mouse brain","type":"publication"},{"authors":["Leonardo Collado-Torres"],"categories":null,"content":"I enjoyed presenting our deconvolution benchmark study for the #SingleCell genomics webinar series for Latin America organized with @eventsWCS support\n📜 https://t.co/hUW5cz3ubm led by @lahuuki \u0026amp; https://t.co/jXHOzyOrf8\nSlides by @lahuuki + minor updateshttps://t.co/CXyUKCD23X\n— 🇲🇽 Leonardo Collado-Torres (@lcolladotor) September 26, 2024 I also presented this talk for LCG-UNAM students as part of their Aplicaciones de la Genómica 2024 course organized by Esperanza Martínez and Alejandra Zayas.\n","date":1727308800,"expirydate":-62135596800,"kind":"page","lang":"en","lastmod":1731265234,"objectID":"3541c168beba98e129c6cd60472c7d4f","permalink":"https://lcolladotor.github.io/talk/wcs2024/","publishdate":"2024-09-26T00:00:00Z","relpermalink":"/talk/wcs2024/","section":"talk","summary":"I enjoyed presenting our deconvolution benchmark study for the #SingleCell genomics webinar series for Latin America organized with @eventsWCS support\n📜 https://t.co/hUW5cz3ubm led by @lahuuki \u0026 https://t.co/jXHOzyOrf8\nSlides by @lahuuki + minor updateshttps://t.","tags":["deconvolution"],"title":"Benchmarking cell type deconvolution methods with human brain data","type":"talk"},{"authors":["Melissa Grant-Peters","Aine Fairbrother-Browne","Amy Hicks","Boyi Guo","Regina H. Reynolds","Louise A. Huuki-Myers","Nicholas J. Eagles","Jonathan Brenton","Sonia Garcia-Ruiz","Nicholas Wood","Sonia Gandhi","Kristen Maynard","Leonardo Collado-Torres","Mina Ryten"],"categories":[],"content":"","date":1718409600,"expirydate":-62135596800,"kind":"page","lang":"en","lastmod":1723564592,"objectID":"872ecdfd29e7f5f1ea86ff593c52ab5e","permalink":"https://lcolladotor.github.io/publication/preprint_lr_network/","publishdate":"2024-06-15T00:00:00Z","relpermalink":"/publication/preprint_lr_network/","section":"publication","summary":"Neurodegenerative disorders have overlapping symptoms and have high comorbidity rates, but this is not reflected in overlaps of risk genes. We have investigated whether ligand-receptor interactions (LRIs) are a mechanism by which distinct genes associated with disease risk can impact overlapping outcomes. We found that LRIs are likely disrupted in neurological disease and that the ligand-receptor networks associated with neurological diseases have substantial overlaps. Specifically, 96.8% of LRIs associated with disease risk are interconnected in a single LR network. These ligands and receptors are enriched for roles in inflammatory pathways and highlight the role of glia in cross-disease risk. Disruption to this LR network due to disease-associated processes (e.g. differential transcript use, protein misfolding) is likely to contribute to disease progression and risk of comorbidity. Our findings have implications for drug development, as they highlight the potential benefits and risks of pursuing cross-disease drug targets.","tags":["LR"],"title":"Network nature of ligand-receptor interactions underlies disease comorbidity in the brain","type":"publication"},{"authors":["Leonardo Collado-Torres"],"categories":null,"content":" ","date":1718236800,"expirydate":-62135596800,"kind":"page","lang":"en","lastmod":1723477883,"objectID":"2d18d3284ab7a767a81a283a7e019e88","permalink":"https://lcolladotor.github.io/talk/fogboston2024/","publishdate":"2024-06-13T00:00:00Z","relpermalink":"/talk/fogboston2024/","section":"talk","summary":" ","tags":["spatial","spatialLIBD","VistoSeg"],"title":"Lessons from spatially-resolved transcriptomics of postmortem human brain data projects","type":"talk"},{"authors":["Louise A. Huuki-Myers","Abby Spangler","Nicholas J. Eagles","Kelsey D. Montgomery","Sang Ho Kwon","Boyi Guo","Melissa Grant-Peters","Heena R. Divecha","Madhavi Tippani","Chaichontat Sriworarat","Annie B. Nguyen","Prashanthi Ravichandran","Matthew N. Tran","Arta Seyedian","PsychENCODE consortium","Thomas M. Hyde","Joel E. Kleinman","Alexis Battle","Stephanie C. Page","Mina Ryten","Stephanie C. Hicks","Keri Martinowich","Leonardo Collado-Torres \u0026dagger;","Kristen R. Maynard \u0026dagger;"],"categories":[],"content":"New in @sciencemagazine: our work from @LieberInstitute #spatialDLPFC applies #snRNAseq and #Visium spatial transcriptomic in the DLPFC to better understand anatomical structure and cellular populations in the human brain #PsychENCODE https://t.co/DKZqmG4YDi https://t.co/Tjp2OjTo63 pic.twitter.com/vQbjts2JtQ\n— Louise Huuki-Myers (@lahuuki) May 23, 2024 Hot of the pre-print press! 🔥 Our latest work #spatialDLPFC pairs #snRNAseq and #Visium spatial transcriptomic data in the human #DLPFC building a neuroanatomical atlas of this critical brain region 🧠@LieberInstitute @10xGenomics #scitwitter\n📰 https://t.co/NJWJ1mwB9J pic.twitter.com/l8W154XZ50\n— Louise Huuki-Myers (@lahuuki) February 17, 2023 ","date":1716508800,"expirydate":-62135596800,"kind":"page","lang":"en","lastmod":1723499641,"objectID":"a9291c7abde764015a625a6df9eb86c9","permalink":"https://lcolladotor.github.io/publication/2024_05_spatialdlpfc/","publishdate":"2024-05-24T00:00:00Z","relpermalink":"/publication/2024_05_spatialdlpfc/","section":"publication","summary":"The molecular organization of the human neocortex historically has been studied in the context of its histological layers. However, emerging spatial transcriptomic technologies have enabled unbiased identification of transcriptionally defined spatial domains that move beyond classic cytoarchitecture. We used the Visium spatial gene expression platform to generate a data-driven molecular neuroanatomical atlas across the anterior-posterior axis of the human dorsolateral prefrontal cortex. Integration with paired single-nucleus RNA-sequencing data revealed distinct cell type compositions and cell-cell interactions across spatial domains. Using PsychENCODE and publicly available data, we mapped the enrichment of cell types and genes associated with neuropsychiatric disorders to discrete spatial domains.","tags":["spatial","spatialDLPFC"],"title":"A data-driven single-cell and spatial transcriptomic map of the human prefrontal cortex","type":"publication"},{"authors":["Nikolaos P Daskalakis","Artemis Iatrou","Chris Chatzinakos","Aarti Jajoo","Clara Snijders","Dennis Wylie","Christopher P DiPietro","Ioulia Tsatsani","Chia-Yen Chen","Cameron D Pernia","Marina Soliva-Estruch","Dhivya Arasappan","Rahul A Bharadwaj","Leonardo Collado-Torres","Stefan Wuchty","Victor E Alvarez","Eric B Dammer","Amy Deep-Soboslay","Duc M Duong","Nicholas J. Eagles","Bertrand R Huber","Louise A. Huuki-Myers","Vincent L Holstein","Mark W Logue","Justina F Lugenbühl","Adam X Maihofer","Mark W Miller","Caroline M Nievergelt","Geo Pertea","Deanna Ross","Mohammad S E Sendi","Benjamin B Sun","Ran Tao","James Tooke","Erika J Wolf","Zane Zeier","Frances A Champagne","Thomas M. Hyde","Nicholas T Seyfried","Joo Heon Shin","Daniel R Weinberger","Charles B Nemeroff","Joel E Kleinman","Kerry J Ressler"],"categories":[],"content":"💡Daskalakis \u0026amp; Ressler labs @McLeanHospital @harvardmed are extremely excited \u0026amp; proud 🥳to share that our collaborative work with Nemeroff @UTAustin and Kleinman @LieberInstitute labs on molecular underpinnings of #PTSD \u0026amp; #MDD is out @ScienceMagazine https://t.co/pcQXbtsXkv! 🧵👇\n— SysBioStress - Daskalakis Lab (@NikosDaskalakis) May 23, 2024 ","date":1716508800,"expirydate":-62135596800,"kind":"page","lang":"en","lastmod":1723577110,"objectID":"3d5fc1055241cc6b473a526a88617a5d","permalink":"https://lcolladotor.github.io/publication/2024_05_nikos_ptsd/","publishdate":"2024-05-24T00:00:00Z","relpermalink":"/publication/2024_05_nikos_ptsd/","section":"publication","summary":"The molecular pathology of stress-related disorders remains elusive. Our brain multiregion, multiomic study of posttraumatic stress disorder (PTSD) and major depressive disorder (MDD) included the central nucleus of the amygdala, hippocampal dentate gyrus, and medial prefrontal cortex (mPFC). Genes and exons within the mPFC carried most disease signals replicated across two independent cohorts. Pathways pointed to immune function, neuronal and synaptic regulation, and stress hormones. Multiomic factor and gene network analyses provided the underlying genomic structure. Single nucleus RNA sequencing in dorsolateral PFC revealed dysregulated (stress-related) signals in neuronal and non-neuronal cell types. Analyses of brain-blood intersections in \u003e50,000 UK Biobank participants were conducted along with fine-mapping of the results of PTSD and MDD genome-wide association studies to distinguish risk from disease processes. Our data suggest shared and distinct molecular pathology in both disorders and propose potential therapeutic targets and biomarkers.","tags":["PTSD"],"title":"Systems biology dissection of PTSD and MDD across brain regions, cell types, and blood","type":"publication"},{"authors":["Leonardo Collado-Torres"],"categories":["Science","LIBD"],"content":" Would you prefer a video walkthrough over reading this blog post? Check out this explainer video 🎥\nA few years ago now (2021) we published a study we refer to with a very generic name: HumanPilot (Maynard, Collado-Torres, Weber, Uytingco et al., 2021). In this peer-reviewed study, we were the first ones to use a commercially available technology for generating spatially-resolved transcriptomics data. It’s called Visium and it’s sold by 10x Genomics. Note ⚠️ that members of that company were co-authors of our study. As we work in the Lieber Institute for Brain Development, we tested Visium with postmortem human brain data. I explained the initial pre-print (before peer-review) version of our work in a blog post back from Feb 29, 2020.\n🔥off the press! 👀 our @biorxivpreprint on human 🧠brain @LieberInstitute spatial 🌌🔬transcriptomics data 🧬using Visium @10xGenomics🎉#spatialLIBD\n🔍https://t.co/RTW0VscUKR 👩🏾💻https://t.co/bsg04XKONr\n📚https://t.co/FJDOOzrAJ6\n📦https://t.co/Au5jwADGhYhttps://t.co/PiWEDN9q2N pic.twitter.com/aWy0yLlR50\n— 🇲🇽 Leonardo Collado-Torres (@lcolladotor) February 29, 2020 But enough with the fancy specific words. Here I explain the main points of why this study was so important and why it is still frequently cited several years later.\nWhat is a fruit? Banana, orange? When we are growing up, we don’t know what is an orange or a banana. What makes them both fruits, and why they are different.\nIf you look at them, touch them, smell them, you start to notice differences between them. In science, we end up trying to come up with systematic and specific ways of describing things that surround us in nature. In this case, two fruits. When you look at an orange and a banana and try to explain how they are different, you might end up slicing them.\nOnce you slice them, you are actively zooming in and looking at finer differences. You might end up using a microscope to notice even smaller differences.\nMeasuring gene activity Now imagine that you want to measure gene 🧬 activity levels. Some previous technologies could measure gene activity levels by taking a chunk of tissue to have enough material for the technology to work. In the 2010s the technology was developed to measure single cells or nuclei, but you lost the spatial context. Then in 2020 the ability to measure gene activity while retaining the spatial awareness was crowned the new method of the year. The specific term is spatially-resolved transcriptomics.\nVisium in particular works by having about 5,000 circles (called “spots”) arranged in a honeycomb pattern 🐝 where we can measure gene activity levels. 10x Genomics has some videos explaining how to it works, but it basically comes down to having an X and Y map for which you can make multiple 3D barplots like this one. Say that this is the one for gene 1 where we have a flat map and the height of the bars is how much that gene 1 was active in each square.\nWith Visium we have 5,000 spots, or specific (X, Y) pairs and for each of them we can have about 2,000 genes measured. So imagine having 2,000 of these 3D barplots. That’s quite a bit of data and it’s exciting to think what this technology can be used for.\nHuman brain Just like we were talking about bananas and oranges being two types of fruits, well, the brain has different regions. Each of them carries out specific functions and can be quite different despite them all clearly remaining a part of the brain. Just like bananas and oranges look very different but still remain fruits.\nNow, scientists by training are skeptical. So with a new exciting but expensive technology, the first thing we wanted to do is to test it with a small study. That is, run a pilot study. We work studying gene activity levels from human brain samples, particularly postmortem human brain samples that were donated to our institution for research purposes. One particular region we are interested in is called the DLPFC and its important because differences between individuals that do not have schizophrenia (which we refer to as the neurotypical control group) and those that do schizophrenia have been linked to this brain region, among other reasons.\nBut before we can distinguish the two groups of donors at the molecular level, with the ultimate goal of helping those affected by disorders such as schizophrenia, we first needed to understand what is typically different neurotypical control (NTC) donors. Just like we can look at different healthy bananas and notice how they are different.\nAnd so we got started with our HumanPilot study. We generated data from 3 NTC donors as you need to look at more than one donor to have an idea of biological variability.\nBut because Visium was a new technology then, we also generated spatially-adjacent replicates (two pairs per donor). These are technical replicates in the sense that we took contiguous slices of tissue. Think of it as two paired slices of bread 10 microns apart: we generated a pair early in the loaf and one more 300 microns …","date":1716422400,"expirydate":-62135596800,"kind":"page","lang":"en","lastmod":1716674284,"objectID":"61077506034f0bd43e8fd0ca6996f70a","permalink":"https://lcolladotor.github.io/2024/05/23/humanpilot-first-spatially-resolved-transcriptomics-study-using-visium/","publishdate":"2024-05-23T00:00:00Z","relpermalink":"/2024/05/23/humanpilot-first-spatially-resolved-transcriptomics-study-using-visium/","section":"post","summary":"Would you prefer a video walkthrough over reading this blog post? Check out this explainer video 🎥\nA few years ago now (2021) we published a study we refer to with a very generic name: HumanPilot (Maynard, Collado-Torres, Weber, Uytingco et al.","tags":["spatialLIBD","spatial","rstats","RNA Sequencing"],"title":"HumanPilot: first spatially-resolved transcriptomics study using Visium","type":"post"},{"authors":["Kynon J.M. Benjamin \u0026dagger;","Qiang Chen","Nicholas J. Eagles","Louise A. Huuki-Myers","Leonardo Collado-Torres","Joshua M. Stolz","Geo Pertea","Joo Heon Shin","Apuã C.M. Paquola","Thomas M. Hyde","Joel E. Kleinman","Andrew E. Jaffe","Shizhong Han \u0026dagger;","Daniel R. Weinberger \u0026dagger;"],"categories":[],"content":"","date":1716163200,"expirydate":-62135596800,"kind":"page","lang":"en","lastmod":1723499641,"objectID":"5b1e2fd0bb45528983ade0d25507e606","permalink":"https://lcolladotor.github.io/publication/2024_05_aanri/","publishdate":"2024-05-20T00:00:00Z","relpermalink":"/publication/2024_05_aanri/","section":"publication","summary":"Ancestral differences in genomic variation affect the regulation of gene expression; however, most gene expression studies have been limited to European ancestry samples or adjusted to identify ancestry-independent associations. Here, we instead examined the impact of genetic ancestry on gene expression and DNA methylation in the postmortem brain tissue of admixed Black American neurotypical individuals to identify ancestry-dependent and ancestry-independent contributions. Ancestry-associated differentially expressed genes (DEGs), transcripts and gene networks, while notably not implicating neurons, are enriched for genes related to the immune response and vascular tissue and explain up to 26% of heritability for ischemic stroke, 27% of heritability for Parkinson disease and 30% of heritability for Alzheimer’s disease. Ancestry-associated DEGs also show general enrichment for the heritability of diverse immune-related traits but depletion for psychiatric-related traits. We also compared Black and non-Hispanic white Americans, confirming most ancestry-associated DEGs. Our results delineate the extent to which genetic ancestry affects differences in gene expression in the human brain and the implications for brain illness risk.","tags":["AANRI","BrainSeq"],"title":"Analysis of gene expression in the postmortem brain of neurotypical Black Americans reveals contributions of genetic ancestry.","type":"publication"},{"authors":["Kynon JM Benjamin \u0026dagger;","Ria Arora","Arthur S. Feltrin","Geo Pertea","Hunter H. Giles","Joshua M. Stolz","Laura D’Ignazio","Leonardo Collado-Torres","Joo Heon Shin","William S. Ulrich","Thomas M Hyde","Joel E Kleinman","Daniel R Weinberger","Apuã CM Paquola \u0026dagger;","Jennifer A Erwin \u0026dagger;"],"categories":[],"content":"","date":1715299200,"expirydate":-62135596800,"kind":"page","lang":"en","lastmod":1723499641,"objectID":"e35b8265ac6e4c0adce26e4cf627fbb6","permalink":"https://lcolladotor.github.io/publication/2024_05_sex_differences_kj/","publishdate":"2024-05-10T00:00:00Z","relpermalink":"/publication/2024_05_sex_differences_kj/","section":"publication","summary":"Schizophrenia is a complex neuropsychiatric disorder with sexually dimorphic features, including differential symptomatology, drug responsiveness, and male incidence rate. Prior large-scale transcriptome analyses for sex differences in schizophrenia have focused on the prefrontal cortex. Analyzing BrainSeq Consortium data (caudate nucleus: n = 399, dorsolateral prefrontal cortex: n = 377, and hippocampus: n = 394), we identified 831 unique genes that exhibit sex differences across brain regions, enriched for immune-related pathways. We observed X-chromosome dosage reduction in the hippocampus of male individuals with schizophrenia. Our sex interaction model revealed 148 junctions dysregulated in a sex-specific manner in schizophrenia. Sex-specific schizophrenia analysis identified dozens of differentially expressed genes, notably enriched in immune-related pathways. Finally, our sex-interacting expression quantitative trait loci analysis revealed 704 unique genes, nine associated with schizophrenia risk. These findings emphasize the importance of sex-informed analysis of sexually dimorphic traits, inform personalized therapeutic strategies in schizophrenia, and highlight the need for increased female samples for schizophrenia analyses.","tags":["BrainSeq","bulk"],"title":"Sex affects transcriptional associations with schizophrenia across the dorsolateral prefrontal cortex, hippocampus, and caudate nucleus","type":"publication"},{"authors":["Leonardo Collado-Torres"],"categories":["Computing","LIBD","rstats"],"content":"This work was done by Leo with Erik Nelson and Ryan Miller. Thank you for your time and input!\nOh ohh! My GitHub repository is huge! 😱 What do I do now? via GIPHY\nOur story That’s how things start. In our case, we had a repository that would download over 22.6 GB of data and use 55.9 GB of disk space. Note: This repository is currently (April 15 2024) private, but will be made public soon.\n% git clone [email protected]:LieberInstitute/spatial_hpc.git Cloning into \u0026#39;spatial_hpc\u0026#39;... remote: Enumerating objects: 18189, done. remote: Counting objects: 100% (1999/1999), done. remote: Compressing objects: 100% (1026/1026), done. remote: Total 18189 (delta 963), reused 1981 (delta 950), pack-reused 16190 Receiving objects: 100% (18189/18189), 22.64 GiB | 12.90 MiB/s, done. Resolving deltas: 100% (9734/9734), done. Updating files: 100% (6667/6667), done. We were able to reduce it such that it now downloads only 5.1 GB of data and takes 12.8 GB of disk space. While this could still be considered large by others, it’s much easier to download and tries to balance publicly providing some plots versus none.\n% git clone [email protected]:LieberInstitute/spatial_hpc.git Cloning into \u0026#39;spatial_hpc\u0026#39;... remote: Enumerating objects: 18451, done. remote: Counting objects: 100% (8112/8112), done. remote: Compressing objects: 100% (2851/2851), done. remote: Total 18451 (delta 4129), reused 7963 (delta 4006), pack-reused 10339 Receiving objects: 100% (18451/18451), 5.13 GiB | 11.41 MiB/s, done. Resolving deltas: 100% (9433/9433), done. Updating files: 100% (5784/5784), done. How were we able to achieve this? We used BFG Repo-Cleaner and removed all files over 10 MB except for two files that we wanted to keep. Steps by steps Get your workspace ready We mostly work on a high performance computing (HPC) environment, aka a compute cluster, called JHPCE. In general for our projects, we have very large files that we do not version control. That is, we ignore them thanks to one or multiple .gitignore files. Given the complexity of differentiating version controlled files from ignored files, my recommendation is to work on your work computer (in my case, a laptop).\nWith this in mind, we did a fresh clone of the repository as shown previously.\n% git clone [email protected]:LieberInstitute/spatial_hpc.git Cloning into \u0026#39;spatial_hpc\u0026#39;... remote: Enumerating objects: 18189, done. remote: Counting objects: 100% (1999/1999), done. remote: Compressing objects: 100% (1026/1026), done. remote: Total 18189 (delta 963), reused 1981 (delta 950), pack-reused 16190 Receiving objects: 100% (18189/18189), 22.64 GiB | 12.90 MiB/s, done. Resolving deltas: 100% (9734/9734), done. Updating files: 100% (6667/6667), done. This is also the first step that BFG recommends that you do. In general, you want to make sure that you have a pristine copy that you can use as a fallback option in case anything goes wrong, and a working copy.\nNote that we missed the --mirror option, although as you’ll see later, we did need to have a full copy of our files in our computer. So I actually recommend that you do not use --mirror. We also downloaded BFG’s latest version: currently that is v1.14.0. This downloads the bfg-1.14.0.jar file. On a macOS computer, you also need to install Java from https://www.java.com/en/download/. As my macOS computer is from the M series system (ARM64), I did have to download the right version for it instead of the one from the big green button that downloads Java for macOS Intel (incompatible with my computer!).\nYou can then test that it’s all working as intended with this command:\n% java -jar ~/Desktop/bfg-1.14.0.jar bfg 1.14.0 Usage: bfg [options] [\u0026lt;repo\u0026gt;] -b, --strip-blobs-bigger-than \u0026lt;size\u0026gt; strip blobs bigger than X (eg \u0026#39;128K\u0026#39;, \u0026#39;1M\u0026#39;, etc) -B, --strip-biggest-blobs NUM strip the top NUM biggest blobs -bi, --strip-blobs-with-ids \u0026lt;blob-ids-file\u0026gt; strip blobs with the specified Git object ids -D, --delete-files \u0026lt;glob\u0026gt; delete files with the specified names (eg \u0026#39;*.class\u0026#39;, \u0026#39;*.{txt,log}\u0026#39; - matches on file name, not path within repo) --delete-folders \u0026lt;glob\u0026gt; delete folders with the specified names (eg \u0026#39;.svn\u0026#39;, \u0026#39;*-tmp\u0026#39; - matches on folder name, not path within repo) --convert-to-git-lfs \u0026lt;value\u0026gt; extract files with the specified names (eg \u0026#39;*.zip\u0026#39; or \u0026#39;*.mp4\u0026#39;) into Git LFS -rt, --replace-text \u0026lt;expressions-file\u0026gt; filter content of files, replacing matched text. Match expressions should be listed in the file, one expression per line - by default, each expression is treated as a literal, but \u0026#39;regex:\u0026#39; \u0026amp; \u0026#39;glob:\u0026#39; prefixes are supported, with \u0026#39;==\u0026gt;\u0026#39; to specify a replacement string other than the default of \u0026#39;***REMOVED***\u0026#39;. -fi, --filter-content-including \u0026lt;glob\u0026gt; do file-content filtering on files that match the specified expression (eg \u0026#39;*.{txt,properties}\u0026#39;) -fe, --filter-content-excluding \u0026lt;glob\u0026gt; don\u0026#39;t do file-content filtering on files that match the specified expression (eg \u0026#39;*.{xml,pdf}\u0026#39;) -fs, --filter-content-size-threshold \u0026lt;size\u0026gt; only do file-content filtering on files smaller …","date":1712793600,"expirydate":-62135596800,"kind":"page","lang":"en","lastmod":1716526022,"objectID":"dfe4c306398bf5d8baac71470569badc","permalink":"https://lcolladotor.github.io/2024/04/11/how-to-reduce-the-size-of-a-large-github-repo/","publishdate":"2024-04-11T00:00:00Z","relpermalink":"/2024/04/11/how-to-reduce-the-size-of-a-large-github-repo/","section":"post","summary":"This work was done by Leo with Erik Nelson and Ryan Miller. Thank you for your time and input!\nOh ohh! My GitHub repository is huge! 😱 What do I do now?","tags":["Git","github","UNIX","rstats"],"title":"How to reduce the size of a large GitHub repo","type":"post"},{"authors":["Sean K. Maden","Louise A. Huuki-Myers","Sang Ho Kwon","Leonardo Collado-Torres","Kristen R. Maynard","Stephanie C. Hicks"],"categories":[],"content":"1/🎉Ecstatic the lute software preprint with my mentor @stephaniehicks deconvolving sn \u0026amp; bulk #rnaseq of human brain is now on #bioRxiv! Thankful to @jhubiostat,@LieberInstitute, and my brilliant colleagues @lahuuki @sanghokwon17 @lcolladotor @kr_maynard 🎉https://t.co/OZKDY9vECL\n— Sean Maden (@MadenSean) April 22, 2024 ","date":1712188800,"expirydate":-62135596800,"kind":"page","lang":"en","lastmod":1723564592,"objectID":"694d5844624626da5800a88819b0b947","permalink":"https://lcolladotor.github.io/publication/preprint_lute/","publishdate":"2024-04-04T00:00:00Z","relpermalink":"/publication/preprint_lute/","section":"publication","summary":"Relative cell type fraction estimates in bulk RNA-sequencing data are important to control for cell composition differences across heterogenous tissue samples. Current computational tools estimate relative RNA abundances rather than cell type proportions in tissues with varying cell sizes, leading to biased estimates. We present lute, a computational tool to accurately deconvolute cell types with varying sizes. Our software wraps existing deconvolution algorithms in a standardized framework. Using simulated and real datasets, we demonstrate how lute adjusts for differences in cell sizes to improve the accuracy of cell composition. Software is available from https://bioconductor.org/packages/lute.","tags":["deconvolution"],"title":"lute: estimating the cell composition of heterogeneous tissue with varying cell sizes using gene expression","type":"publication"},{"authors":["Ege A. Yalcinbas __*__","Bukola Ajanaku __*__","Erik D. Nelson","Renee Garcia-Flores","Nicholas J. Eagles","Kelsey D. Montgomery","Joshua M. Stolz","Joshua Wu","Heena R. Divecha","Atharv Chandra","Rahul A. Bharadwaj","Svitlana Bach","Anandita Rajpurohit","Ran Tao","Geo Pertea","Joo Heon Shin","Joel E. Kleinman","Thomas M. Hyde","Daniel R. Weinberger","Louise A. Huuki-Myers","Leonardo Collado-Torres","Kristen R. Maynard \u0026dagger;"],"categories":[],"content":"I’m excited to share our first human habenula study comparing transcriptomic data from neurotypical control postmortem tissue and schizophrenia cases! 🧠 #HabenulaLIBD #snRNAseq #Habenula This is my first paper as co-corresponding author!\n📎 https://t.co/tePWIaSQXB pic.twitter.com/M2CTDRKz3O\n— Louise Huuki-Myers (@lahuuki) March 7, 2024 It\u0026#39;s great to see #HabenulaLIBD on @biorxivpreprint and be publicly accessible to you. It\u0026#39;s a major milestone (peer review is next 🤞🏽)\nIt also feels like the end of a large cycle. At the same time, it\u0026#39;s the start of Hb 🧠work we are pursuing with @kr_maynard @LieberInstitute 🔬 pic.twitter.com/UbFpYwdRtx\n— 🇲🇽 Leonardo Collado-Torres (@lcolladotor) March 7, 2024 ","date":1708905600,"expirydate":-62135596800,"kind":"page","lang":"en","lastmod":1723564592,"objectID":"1d3bd7d0d619883ecb7fe6bcb2f789b3","permalink":"https://lcolladotor.github.io/publication/preprint_habenulapilot/","publishdate":"2024-02-26T00:00:00Z","relpermalink":"/publication/preprint_habenulapilot/","section":"publication","summary":"Pathophysiology of many neuropsychiatric disorders, including schizophrenia (SCZD), is linked to habenula (Hb) function. While pharmacotherapies and deep brain stimulation targeting the Hb are emerging as promising therapeutic treatments, little is known about the cell type-specific transcriptomic organization of the human Hb or how it is altered in SCZD. Here we define the molecular neuroanatomy of the human Hb and identify transcriptomic changes in individuals with SCZD compared to neurotypical controls. Utilizing Hb-enriched postmortem human brain tissue, we performed single nucleus RNA-sequencing (snRNA-seq; n=7 neurotypical donors) and identified 17 molecularly defined Hb cell types across 16,437 nuclei, including 3 medial and 7 lateral Hb populations, several of which were conserved between rodents and humans. Single molecule fluorescent in situ hybridization (smFISH; n=3 neurotypical donors) validated snRNA-seq Hb cell types and mapped their spatial locations. Bulk RNA-sequencing and cell type deconvolution in Hb-enriched tissue from 35 individuals with SCZD and 33 neurotypical controls yielded 45 SCZD-associated differentially expressed genes (DEGs, FDR \u003c 0.05), with 32 (71%) unique to Hb-enriched tissue. eQTL analysis identified 717 independent SNP-gene pairs (FDR \u003c 0.05), where either the SNP is a SCZD risk variant (16 pairs) or the gene is a SCZD DEG (7 pairs). eQTL and SCZD risk colocalization analysis identified 16 colocalized genes. These results identify topographically organized cell types with distinct molecular signatures in the human Hb and demonstrate unique genetic changes associated with SCZD, thereby providing novel molecular insights into the role of Hb in neuropsychiatric disorders.","tags":["BrainSeq"],"title":"Transcriptomic analysis of the human habenula in schizophrenia","type":"publication"},{"authors":["Leonardo Collado-Torres"],"categories":null,"content":"Thanks @kenzhou86 \u0026amp; Margaret Taub for inviting to present at the Current Topics in Biostatistics seminar\nIt was fun reminiscing about the past \u0026amp; sharing my experience. Got them to laugh a few times ^^\nHere are my notes 📔https://t.co/Dm2EqyeIL7@jhubiostat @LieberInstitute\n— 🇲🇽 Leonardo Collado-Torres (@lcolladotor) February 26, 2024 ","date":1708560000,"expirydate":-62135596800,"kind":"page","lang":"en","lastmod":1708978936,"objectID":"1490f14cbffa4b22b67bda4181b39c43","permalink":"https://lcolladotor.github.io/talk/currentbiostats2024/","publishdate":"2024-02-22T00:00:00Z","relpermalink":"/talk/currentbiostats2024/","section":"talk","summary":"Thanks @kenzhou86 \u0026 Margaret Taub for inviting to present at the Current Topics in Biostatistics seminar\nIt was fun reminiscing about the past \u0026 sharing my experience. Got them to laugh a few times ^^","tags":["spatial","spatialLIBD"],"title":"2024 Current Topics in Biostatistics guest seminar","type":"talk"},{"authors":["Louise A. Huuki-Myers","Kelsey D. Montgomery __*__","Sang Ho Kwon","Sophia Cinquemani","Nicholas J. Eagles","Daianna Gonzalez-Padilla","Sean K. Maden","Joel E. Kleinman","Thomas M. Hyde","Stephanie C. Hicks","Kristen R. Maynard \u0026dagger;","Leonardo Collado-Torres"],"categories":[],"content":"Hey #deconvolution fans! 👀 We’ve got an exciting new pre-print for you: a benchmark of 6 popular deconvolution methods on a multimodal human brain #DLPFC dataset 🧠🧬 @LieberInstitute @jhubiostat #scitwitter 📎 https://t.co/4KXibeerZi pic.twitter.com/0O8E5emIeP\n— Louise Huuki-Myers (@lahuuki) April 15, 2024 ","date":1707436800,"expirydate":-62135596800,"kind":"page","lang":"en","lastmod":1723564592,"objectID":"9fdadb8c7a9c18a8a3121c0083608720","permalink":"https://lcolladotor.github.io/publication/preprint_deconvo_benchmark/","publishdate":"2024-02-09T00:00:00Z","relpermalink":"/publication/preprint_deconvo_benchmark/","section":"publication","summary":"**Background** Cellular deconvolution of bulk RNA-sequencing (RNA-seq) data using single cell or nuclei RNA-seq (sc/snRNA-seq) reference data is an important strategy for estimating cell type composition in heterogeneous tissues, such as human brain. Computational methods for deconvolution have been developed and benchmarked against simulated data, pseudobulked sc/snRNA-seq data, or immunohistochemistry reference data. A major limitation in developing improved deconvolution algorithms has been the lack of integrated datasets with orthogonal measurements of gene expression and estimates of cell type proportions on the same tissue sample. Deconvolution algorithm performance has not yet been evaluated across different RNA extraction methods (cytosolic, nuclear, or whole cell RNA), different library preparation types (mRNA enrichment vs. ribosomal RNA depletion), or with matched single cell reference datasets.\n**Results** A rich multi-assay dataset was generated in postmortem human dorsolateral prefrontal cortex (DLPFC) from 22 tissue blocks. Assays included spatially-resolved transcriptomics, snRNA-seq, bulk RNA-seq (across six library/extraction RNA-seq combinations), and RNAScope/Immunofluorescence (RNAScope/IF) for six broad cell types. The Mean Ratio method, implemented in the DeconvoBuddies R package, was developed for selecting cell type marker genes. Six computational deconvolution algorithms were evaluated in DLPFC and predicted cell type proportions were compared to orthogonal RNAScope/IF measurements.\n**Conclusions** Bisque and hspe were the most accurate methods, were robust to differences in RNA library types and extractions. This multi-assay dataset showed that cell size differences, marker genes differentially quantified across RNA libraries, and cell composition variability in reference snRNA-seq impact the accuracy of current deconvolution methods.","tags":["deconvolution"],"title":"Benchmark of cellular deconvolution methods using a multi-assay reference dataset from postmortem human prefrontal cortex","type":"publication"},{"authors":["Lukas M. Weber","Heena R. Divecha","Matthew N. Tran","Sang Ho Kwon","Abby Spangler","Kelsey D. Montgomery","Madhavi Tippani","Rahul Bharadwaj","Joel E. Kleinman","Stephanie C Page","Thomas M. Hyde","Leonardo Collado-Torres","Kristen R. Maynard","Keri Martinowich \u0026dagger;","Stephanie C. Hicks \u0026dagger;"],"categories":[],"content":"Very happy to share our preprint on spatially-resolved transcriptomics and single-nucleus RNA-sequencing in the human locus coeruleus! 🎉🧠🔵 https://t.co/L69G2P9PO6\n— Lukas Weber (@lmwebr) October 31, 2022 ","date":1706054400,"expirydate":-62135596800,"kind":"page","lang":"en","lastmod":1723564592,"objectID":"5f706c98ff34e7f2c2cffb338b819374","permalink":"https://lcolladotor.github.io/publication/2024_01_locus-c/","publishdate":"2024-01-24T00:00:00Z","relpermalink":"/publication/2024_01_locus-c/","section":"publication","summary":"Norepinephrine (NE) neurons in the locus coeruleus (LC) make long-range projections throughout the central nervous system, playing critical roles in arousal and mood, as well as various components of cognition including attention, learning, and memory. The LC-NE system is also implicated in multiple neurological and neuropsychiatric disorders. Importantly, LC-NE neurons are highly sensitive to degeneration in both Alzheimer’s and Parkinson’s disease. Despite the clinical importance of the brain region and the prominent role of LC-NE neurons in a variety of brain and behavioral functions, a detailed molecular characterization of the LC is lacking. Here, we used a combination of spatially-resolved transcriptomics and single-nucleus RNA-sequencing to characterize the molecular landscape of the LC region and the transcriptomic profile of LC-NE neurons in the human brain. We provide a freely accessible resource of these data in web-accessible and downloadable formats.","tags":["spatial"],"title":"The gene expression landscape of the human locus coeruleus revealed by single-nucleus and spatially-resolved transcriptomics","type":"publication"},{"authors":["Lionel A. Rodriguez","Matthew Nguyen Tran","Renee Garcia-Flores","Seyun Oh","Robert A. Phillips III","Elizabeth A. Pattie","Heena R. Divecha","Sun Hong Kim","Joo Heon Shin,","ong Kyu Lee","Carly Montoya","Andrew E. Jaffe","Leonardo Collado-Torres","Stephanie C. Page \u0026dagger;","Keri Martinowich \u0026dagger;"],"categories":[],"content":"The final part of my thesis work is out! Never did I think I’d end my thesis by doing anything computational, especially RNA-sequencing, but here we are! Couldn’t have done it without @mattntran and @SubmarineGene’s help and patience, and @lcolladotor and @martinowk’s guidance ❤️ https://t.co/uHmWKa5NPp\n— Lionel Rodriguez, Ph.D. 🇲🇽🏳️🌈 (@rodriguez_lion) January 24, 2024 ","date":1705968000,"expirydate":-62135596800,"kind":"page","lang":"en","lastmod":1723577110,"objectID":"666814ddeaff8bf262f4b66cceb3c541","permalink":"https://lcolladotor.github.io/publication/2024_01_septum_lateral/","publishdate":"2024-01-23T00:00:00Z","relpermalink":"/publication/2024_01_septum_lateral/","section":"publication","summary":"The lateral septum (LS), a GABAergic structure located in the basal forebrain, is implicated in social behavior, learning, and memory. We previously demonstrated that expression of tropomyosin kinase receptor B (TrkB) in LS neurons is required for social novelty recognition. To better understand molecular mechanisms by which TrkB signaling controls behavior, we locally knocked down TrkB in LS and used bulk RNA-sequencing to identify changes in gene expression downstream of TrkB. TrkB knockdown induces upregulation of genes associated with inflammation and immune responses, and downregulation of genes associated with synaptic signaling and plasticity. Next, we generated one of the first atlases of molecular profiles for LS cell types using single nucleus RNA-sequencing (snRNA-seq). We identified markers for the septum broadly, and the LS specifically, as well as for all neuronal cell types. We then investigated whether the differentially expressed genes (DEGs) induced by TrkB knockdown map to specific LS cell types. Enrichment testing identified that downregulated DEGs are broadly expressed across neuronal clusters. Enrichment analyses of these DEGs demonstrated that downregulated genes are uniquely expressed in the LS, and associated with either synaptic plasticity or neurodevelopmental disorders. Upregulated genes are enriched in LS microglia, associated with immune response and inflammation, and linked to both neurodegenerative disease and neuropsychiatric disorders. In addition, many of these genes are implicated in regulating social behaviors. In summary, the findings implicate TrkB signaling in the LS as a critical regulator of gene networks associated with psychiatric disorders that display social deficits, including schizophrenia and autism, and with neurodegenerative diseases, including Alzheimer's.","tags":["septum_lateral"],"title":"TrkB-dependent regulation of molecular signaling across septal cell types","type":"publication"},{"authors":["Sean K. Maden","Sang Ho Kown","Louise A. Huuki-Myers","Leonardo Collado-Torres","Stephanie C. Hicks \u0026dagger;","Kristen R. Maynard \u0026dagger;"],"categories":[],"content":"You can now read my first preprint as a @jhubiostat postdoc, in collaboration with @LieberInstitute -- a commentary on #transcriptomics #deconvolution challenges \u0026amp; opportunities for heterogeneous tissues! A tweetorial... 1/ 🧬🧪💻🔥#deconvochallenge 🔥 https://t.co/GsvpMgTTPj\n— Sean Maden (@MadenSean) May 15, 2023 ","date":1702512000,"expirydate":-62135596800,"kind":"page","lang":"en","lastmod":1723564592,"objectID":"7d7c54e06c6d332ef6dba952eb6a0369","permalink":"https://lcolladotor.github.io/publication/2023_12_deconvo_challenges/","publishdate":"2023-12-14T00:00:00Z","relpermalink":"/publication/2023_12_deconvo_challenges/","section":"publication","summary":"Deconvolution of cell mixtures in “bulk” transcriptomic samples from homogenate human tissue is important for understanding disease pathologies. However, several experimental and computational challenges impede transcriptomics-based deconvolution approaches using single-cell/nucleus RNA-seq reference atlases. Cells from the brain and blood have substantially different sizes, total mRNA, and transcriptional activities, and existing approaches may quantify total mRNA instead of cell type proportions. Further, standards are lacking for the use of cell reference atlases and integrative analyses of single-cell and spatial transcriptomics data. We discuss how to approach these key challenges with orthogonal “gold standard” datasets for evaluating deconvolution methods.","tags":["deconvolution"],"title":"Challenges and opportunities to computationally deconvolve heterogeneous tissue with varying cell sizes using single-cell RNA-sequencing datasets","type":"publication"},{"authors":["Boyi Guo","Louise A. Huuki-Myers","Melissa Grant-Peters","Leonardo Collado-Torres","Stephanie C. Hicks"],"categories":[],"content":"🚨new preprint alert 🚨\n⭐️escheR: Unified multi-dimensional visualizations with Gestalt principles⭐️\n⁰🖨️: https://t.co/83VoUY42ap\nWe introduce Gestalt principles to optimize spatial visualizations, specifically joint visualization of multi-dimensional data. (🧵) pic.twitter.com/gYBbMbEBW6\n— Boyi Guo 郭博逸 (@BoyiGuo) March 28, 2023 ","date":1701820800,"expirydate":-62135596800,"kind":"page","lang":"en","lastmod":1723499641,"objectID":"47e8d21c0a4af60b6dda6e4591bdc8ca","permalink":"https://lcolladotor.github.io/publication/2023_12_escher/","publishdate":"2023-12-06T00:00:00Z","relpermalink":"/publication/2023_12_escher/","section":"publication","summary":"The creation of effective visualizations is a fundamental component of data analysis. In biomedical research, new challenges are emerging to visualize multi-dimensional data in a 2D space, but current data visualization tools have limited capabilities. To address this problem, we leverage Gestalt principles to improve the design and interpretability of multi-dimensional data in 2D data visualizations, layering aesthetics to display multiple variables. The proposed visualization can be applied to spatially-resolved transcriptomics data, but also broadly to data visualized in 2D space, such as embedding visualizations. We provide an open source R package escheR, which is built off of the state-of-the-art ggplot2 visualization framework and can be seamlessly integrated into genomics toolboxes and workflows.","tags":["spatial","spatialDLPFC"],"title":"escheR: Unified multi-dimensional visualizations with Gestalt principles","type":"publication"},{"authors":["Anthony D. Ramnauth","Madhavi Tippani","Heena R. Divecha","Alexis R. Papariello","Ryan A. Miller","Erik D. Nelson","Elizabeth A. Pattie","Joel E. Kleinman","Kristen R. Maynard","Leonardo Collado-Torres","Thomas M. Hyde","Keri Martinowich \u0026dagger;","Stephanie C. Hicks \u0026dagger;","Stephanie C. Page \u0026dagger;"],"categories":[],"content":"","date":1700438400,"expirydate":-62135596800,"kind":"page","lang":"en","lastmod":1723564592,"objectID":"4dd5a861383d302443b74a441bd5d131","permalink":"https://lcolladotor.github.io/publication/preprint_spatial_dg_lifespan/","publishdate":"2023-11-20T00:00:00Z","relpermalink":"/publication/preprint_spatial_dg_lifespan/","section":"publication","summary":"The dentate gyrus of the hippocampus is important for many cognitive functions, including learning, memory, and mood. Here, we investigated age-associated changes in transcriptome-wide spatial gene expression in the human dentate gyrus across the lifespan. Genes associated with neurogenesis and the extracellular matrix were enriched in infants, while gene markers of inhibitory neurons and cell proliferation showed increases and decreases in post-infancy, respectively. While we did not find evidence for neural proliferation post-infancy, we did identify molecular signatures supporting protracted maturation of granule cells. We also identified a wide-spread hippocampal aging signature and an age-associated increase in genes related to neuroinflammation. Our findings suggest major changes to the putative neurogenic niche after infancy and identify molecular foci of brain aging in glial and neuropil enriched tissue.","tags":["spatial"],"title":"Spatiotemporal analysis of gene expression in the human dentate gyrus reveals age-associated changes in cellular maturation and neuroinflammation","type":"publication"},{"authors":["Madhavi Tippani","Heena R. Divecha","Joseph L. Catallini II","Sang Ho Kwon","Lukas M. Weber","Abby Spangler","Andrew E. Jaffe","Thomas M. Hyde","Joel E. Kleinman","Stephanie C. Hicks","Keri Martinowich","Leonardo Collado-Torres","Stephanie C. Page \u0026dagger;","Kristen R. Maynard \u0026dagger;"],"categories":[],"content":"Excited to share my 1st, first-author paper: https://t.co/x7SInbaVcy. Learned \u0026amp; accomplished so much through this process - can now call myself a ‘bookdown’, ‘LaTeX’, ‘@Overleaf’, ‘@bioRxiv, ‘@Git’ expert. Thanks to my mentors @lcolladotor , @martinowk , @CerceoPage , @kr_maynard pic.twitter.com/rDcyllvylz\n— MadhaviTippani (@MadhaviTippani) August 6, 2021 ","date":1699833600,"expirydate":-62135596800,"kind":"page","lang":"en","lastmod":1723499641,"objectID":"cf139d499f8942ac32c4e067e53e708d","permalink":"https://lcolladotor.github.io/publication/2023_11_vistoseg/","publishdate":"2023-11-13T00:00:00Z","relpermalink":"/publication/2023_11_vistoseg/","section":"publication","summary":"Spatially resolved transcriptomics (SRT) is a growing field that links gene expression to anatomical context. SRT approaches that use next-generation sequencing (NGS) combine RNA sequencing with histological or fluorescent imaging to generate spatial maps of gene expression in intact tissue sections. These technologies directly couple gene expression measurements with high-resolution histological or immunofluorescent images that contain rich morphological information about the tissue under study. While broad access to NGS-based spatial transcriptomic technology is now commercially available through the Visium platform from the vendor 10× Genomics, computational tools for extracting image-derived metrics for integration with gene expression data remain limited. We developed _VistoSeg_ as a MATLAB pipeline to process, analyze and interactively visualize the high-resolution images generated in the Visium platform. _VistoSeg_ outputs can be easily integrated with accompanying transcriptomic data to facilitate downstream analyses in common programing languages including R and Python. _VistoSeg_ provides user-friendly tools for integrating image-derived metrics from histological and immunofluorescent images with spatially resolved gene expression data. Integration of this data enhances the ability to understand the transcriptional landscape within tissue architecture. _VistoSeg_ is freely available at http://research.libd.org/VistoSeg/.","tags":["spatial","VistoSeg","spatialDLPFC"],"title":"VistoSeg: Processing utilities for high-resolution images for spatially resolved transcriptomics data","type":"publication"},{"authors":["Leonardo Collado-Torres","Lambertus Klei","Chunyu Liu","Joel E. Kleinman","Thomas M. Hyde","Daniel H. Geschwind","Michael J. Gandal","Bernie Devlin","Daniel R. Weinberger"],"categories":[],"content":"","date":1699401600,"expirydate":-62135596800,"kind":"page","lang":"en","lastmod":1723564592,"objectID":"0a7c01a7cb8a9938faa12da5ce3bf5ea","permalink":"https://lcolladotor.github.io/publication/preprint_lbp_reanalysis/","publishdate":"2023-11-08T00:00:00Z","relpermalink":"/publication/preprint_lbp_reanalysis/","section":"publication","summary":"Molecular mechanisms of neuropsychiatric disorders are challenging to study in human brain. For decades, the preferred model has been to study postmortem human brain samples despite the limitations they entail. A recent study generated RNA sequencing data from biopsies of prefrontal cortex from living patients with Parkinson’s Disease and compared gene expression to postmortem tissue samples, from which they found vast differences between the two. This led the authors to question the utility of postmortem human brain studies. Through re-analysis of the same data, we unexpectedly found that the living brain tissue samples were of much lower quality than the postmortem samples across multiple standard metrics. We also performed simulations that illustrate the effects of ignoring RNA degradation in differential gene expression analyses, showing the effects can be substantial and of similar magnitude to what the authors find. For these reasons, we believe the authors’ conclusions are unjustified. To the contrary, while opportunities to study gene expression in the living brain are welcome, evidence that this eclipses the value of postmortem analyses is not apparent.","tags":["LBP"],"title":"Comparison of gene expression in living and postmortem human brain","type":"publication"},{"authors":["Louise A. Huuki-Myers","Kelsey D. Montgomery","Sang Ho Kwon","Stephanie C. Page","Stephanie C. Hicks","Kristen R. Maynard \u0026dagger;","Leonardo Collado-Torres \u0026dagger;"],"categories":[],"content":"Excited to share my first 🥇 first-author manuscript: \u0026#34;Data-driven Identification of Total RNA Expression Genes (TREGs) for Estimation of RNA Abundance in Heterogeneous Cell Types\u0026#34; 👩🔬 @LieberInstitute #scitwitter\nNow a @biorxivpreprint ! 🎉\n📰 https://t.co/OJuAWndW51 pic.twitter.com/VZ8xzJpcyv\n— Louise Huuki-Myers (@lahuuki) May 3, 2022 To end the week: CONGRATS @lahuuki for your first first-author @biorxivpreprint 📜! 🎉 The first of many I\u0026#39;m 💯 sure!#rstats @LieberInstitute\n📦@Bioconductor https://t.co/5f79NtYyFu\n💻@GitHub https://t.co/Hpg8rKLsst\n📔#pkgdown https://t.co/6of1LCtxgC\n👀https://t.co/J0uJA15liE pic.twitter.com/uUPZEUXns9\n— 🇲🇽 Leonardo Collado-Torres (@lcolladotor) April 30, 2022 ","date":1697414400,"expirydate":-62135596800,"kind":"page","lang":"en","lastmod":1723499641,"objectID":"4d956e4a722b1b1bc0d5d1921190f5fd","permalink":"https://lcolladotor.github.io/publication/2023_10_treg/","publishdate":"2023-10-16T00:00:00Z","relpermalink":"/publication/2023_10_treg/","section":"publication","summary":"We define and identify a new class of control genes for next-generation sequencing called total RNA expression genes (TREGs), which correlate with total RNA abundance in cell types of different sizes and transcriptional activity. We provide a data-driven method to identify TREGs from single-cell RNA sequencing data, allowing the estimation of total amount of RNA when restricted to quantifying a limited number of genes. We demonstrate our method in postmortem human brain using multiplex single-molecule fluorescent in situ hybridization and compare candidate TREGs against classic housekeeping genes. We identify AKT3 as a top TREG across five brain regions.","tags":["deconvolution","TREG"],"title":"Data-driven identification of total RNA expression genes for estimation of RNA abundance in heterogeneous cell types highlighted in brain tissue","type":"publication"},{"authors":["Sang Ho Kwon","Sowmya Parthiban","Madhavi Tippani","Heena R. Divecha","Nicholas J. Eagles","Jashandeep S. Lobana","Stephen R. Williams","Michelle Mak","Rahul A. Bharadwaj","Joel E. Kleinman","Thomas M. Hyde","Stephanie C. Page","Stephanie C. Hicks \u0026dagger;","Keri Martinowich \u0026dagger;","Kristen R. Maynard \u0026dagger;","Leonardo Collado-Torres \u0026dagger;"],"categories":[],"content":"After 10+ years of research, my FIRST 1st-author paper \u0026amp; @biorxivpreprint is finally OUT🥹I delved deep into the human inferior temporal cortex🧠in #Alzheimersdisease, using #VisiumSPG #VectraPolaris #RNAscope \u0026amp; #HALO @Indica_Labs. Check out our📜at https://t.co/QQEy1ZWc1V🔥 pic.twitter.com/dBZNzL1S96\n— Sang Ho (Sangho) Kwon (@sanghokwon17) April 24, 2023 ","date":1697414400,"expirydate":-62135596800,"kind":"page","lang":"en","lastmod":1723499641,"objectID":"48f3d3af442f9e83bcb5bb9d91504676","permalink":"https://lcolladotor.github.io/publication/2023_10_visium_spg_ad/","publishdate":"2023-10-16T00:00:00Z","relpermalink":"/publication/2023_10_visium_spg_ad/","section":"publication","summary":"Neuropathological lesions in the brains of individuals affected with neurodegenerative disorders are hypothesized to trigger molecular and cellular processes that disturb the homeostasis of local microenvironments. Here, we applied the 10x Genomics Visium Spatial Proteogenomics (Visium-SPG) platform, which couples spatial gene expression with immunofluorescence (IF) protein co-detection, to evaluate its ability to quantify changes in spatial gene expression with respect to amyloid-beta (Aβ) and hyperphosphorylated tau (pTau) pathology in post-mortem human brain tissue from individuals with Alzheimer's disease (AD). We identified transcriptomic signatures associated with proximity to Aβ in the human inferior temporal cortex during late-stage AD, which we further investigated at cellular resolution with combined IF and single-molecule fluorescent in situ hybridization (smFISH). The study provides a data analysis workflow for Visium-SPG, and the data represent a proof-of-principle for the power of multi-omic profiling in identifying changes in molecular dynamics that are spatially associated with pathology in the human brain. We provide the scientific community with web-based, interactive resources to access the datasets of the spatially resolved AD-related transcriptomes.","tags":["spatial","VistoSeg","Visium_SPG_AD"],"title":"Influence of Alzheimer's Disease Related Neuropathology on Local Microenvironment Gene Expression in the Human Inferior Temporal Cortex","type":"publication"},{"authors":["Leonardo Collado-Torres"],"categories":null,"content":" Join me and others for free** at #FOGBoston October 4-5 2023 https://t.co/5BGgkBKZuN ⚾️🧦🎉\nI\u0026#39;ll talk about our work at @LieberInstitute @jhubiostat on spatially-resolved transcriptomics using #Visium #VisiumSPG by @10xGenomics 🎫 https://t.co/faX3eB47u2 pic.twitter.com/9ohIIKqnDU\n— 🇲🇽 Leonardo Collado-Torres (@lcolladotor) July 21, 2023 ","date":1696377600,"expirydate":-62135596800,"kind":"page","lang":"en","lastmod":1708978936,"objectID":"524c57b1ea7b17d52f40fbef807b61e6","permalink":"https://lcolladotor.github.io/talk/fogboston2023/","publishdate":"2023-10-04T00:00:00Z","relpermalink":"/talk/fogboston2023/","section":"talk","summary":"Join me and others for free** at #FOGBoston October 4-5 2023 https://t.co/5BGgkBKZuN ⚾️🧦🎉\nI'll talk about our work at @LieberInstitute @jhubiostat on spatially-resolved transcriptomics using #Visium #VisiumSPG by @10xGenomics 🎫 https://t.","tags":["spatial","spatialLIBD","VistoSeg","Visium_SPG_AD","deconvolution"],"title":"Lessons from spatially-resolved transcriptomics of postmortem human brain data projects","type":"talk"},{"authors":["Nicholas J. Eagles","Richard Wilton","Andrew E. Jaffe","Leonardo Collado-Torres"],"categories":[],"content":" We are excited to share with you our latest @biorxivpreprint: BiocMAP: A @Bioconductor-friendly, GPU-Accelerated Pipeline for Bisulfite-Sequencing Data #WGBS\nCongrats for the excellent work independently leading this project Nick https://t.co/O3u5XRPXy2!https://t.co/Td65Ns6Tp7 pic.twitter.com/HMjaU6kUl8\n— 🇲🇽 Leonardo Collado-Torres (@lcolladotor) April 22, 2022 ","date":1694563200,"expirydate":-62135596800,"kind":"page","lang":"en","lastmod":1723499641,"objectID":"c788e8497f0e85da4f7f94e66d3576b8","permalink":"https://lcolladotor.github.io/publication/2023_09_biocmap/","publishdate":"2023-09-13T00:00:00Z","relpermalink":"/publication/2023_09_biocmap/","section":"publication","summary":"**Background** Bisulfite sequencing is a powerful tool for profiling genomic methylation, an epigenetic modification critical in the understanding of cancer, psychiatric disorders, and many other conditions. Raw data generated by whole genome bisulfite sequencing (WGBS) requires several computational steps before it is ready for statistical analysis, and particular care is required to process data in a timely and memory-efficient manner. Alignment to a reference genome is one of the most computationally demanding steps in a WGBS workflow, taking several hours or even days with commonly used WGBS-specific alignment software. This naturally motivates the creation of computational workflows that can utilize GPU-based alignment software to greatly speed up the bottleneck step. In addition, WGBS produces raw data that is large and often unwieldy; a lack of memory-efficient representation of data by existing pipelines renders WGBS impractical or impossible to many researchers.\n**Results** We present BiocMAP, a Bioconductor-friendly methylation analysis pipeline consisting of two modules, to address the above concerns. The first module performs computationally-intensive read alignment using Arioc, a GPU-accelerated short-read aligner. Since GPUs are not always available on the same computing environments where traditional CPU-based analyses are convenient, the second module may be run in a GPU-free environment. This module extracts and merges DNA methylation proportions—the fractions of methylated cytosines across all cells in a sample at a given genomic site. Bioconductor-based output objects in R utilize an on-disk data representation to drastically reduce required main memory and make WGBS projects computationally feasible to more researchers.\n**Conclusions** BiocMAP is implemented using Nextflow and available at http://research.libd.org/BiocMAP/. To enable reproducible analysis across a variety of typical computing environments, BiocMAP can be containerized with Docker or Singularity, and executed locally or with the SLURM or SGE scheduling engines. By providing Bioconductor objects, BiocMAP’s output can be integrated with powerful analytical open source software for analyzing methylation data.","tags":[],"title":"BiocMAP: A Bioconductor-friendly, GPU-Accelerated Pipeline for Bisulfite-Sequencing Data","type":"publication"},{"authors":["Leonardo Collado-Torres"],"categories":null,"content":" ¡Seguimos! #LCG20 Simposio # 5: Spatial Transcriptomics https://t.co/I8J3PXRqAT @ccg_unam @ibt_unam @unammorelos @lcolladotor @daniela_oaks @roramirezf94 #EnVivo pic.twitter.com/mcrdyTABqa\n— LCG UNAM (@lcgunam) August 31, 2023 ","date":1693353600,"expirydate":-62135596800,"kind":"page","lang":"en","lastmod":1708978936,"objectID":"6ccff9ffb44b4e0e6d38bf7788a18fec","permalink":"https://lcolladotor.github.io/talk/lcg20year/","publishdate":"2023-08-30T00:00:00Z","relpermalink":"/talk/lcg20year/","section":"talk","summary":" ¡Seguimos! #LCG20 Simposio # 5: Spatial Transcriptomics https://t.co/I8J3PXRqAT @ccg_unam @ibt_unam @unammorelos @lcolladotor @daniela_oaks @roramirezf94 #EnVivo pic.twitter.com/mcrdyTABqa\n— LCG UNAM (@lcgunam) August 31, 2023 ","tags":["derfinder","recount2","spatial","spatialLIBD","VistoSeg","Visium_SPG_AD","deconvolution"],"title":"Studying the human prefrontal cortex transcriptome at different resolutions","type":"talk"},{"authors":["Leonardo Collado-Torres"],"categories":null,"content":" ","date":1690934400,"expirydate":-62135596800,"kind":"page","lang":"en","lastmod":1708978936,"objectID":"f986cbad5012379e8ed6a18ec4fa0e83","permalink":"https://lcolladotor.github.io/talk/bioc2023/","publishdate":"2023-08-02T00:00:00Z","relpermalink":"/talk/bioc2023/","section":"talk","summary":"spatialLIBD workshop for BioC2023","tags":["spatial","spatialLIBD"],"title":"BioC2023 Package Demo: analyzing spatially-resolved transcriptomics data from Visium using spatialLIBD","type":"talk"},{"authors":["Leonardo Collado-Torres"],"categories":null,"content":" ","date":1689638400,"expirydate":-62135596800,"kind":"page","lang":"en","lastmod":1708978936,"objectID":"86aff22dc4595179671bfea2905175ae","permalink":"https://lcolladotor.github.io/talk/verge2023/","publishdate":"2023-07-18T00:00:00Z","relpermalink":"/talk/verge2023/","section":"talk","summary":"Invited seminar by Sebastian Guelfi","tags":["spatial","spatialLIBD","VistoSeg","Visium_SPG_AD","deconvolution"],"title":"Lessons from working on the edge of human brain transcriptomics with spatially-resolved transcriptomics and deconvolution","type":"talk"},{"authors":["Chaichontat Sriworarat","Annie Nguyen","Nicholas J. Eagles","Leonardo Collado-Torres","Keri Martinowich","Kristen R. Maynard \u0026dagger;","Stephanie C. Hicks \u0026dagger;"],"categories":[],"content":"📣 Updates on this 🧵 We changed Loopy Browser --\u0026gt; Samui Browser! Same tool, new name (after Ko Samui 🏝️ in Thailand)#interactive #image #viewer #dataviz #spatial #georeferencing @chaichontat\n🔗 https://t.co/7lbqOsgOsh\n📖 https://t.co/MQhaS5U0Tk\n💻 https://t.co/CJc7bl0bjH https://t.co/rElsnxYFXH\n— Stephanie Hicks (@stephaniehicks.bsky.social) (@stephaniehicks) February 26, 2023 ","date":1689120000,"expirydate":-62135596800,"kind":"page","lang":"en","lastmod":1723499641,"objectID":"2d9ba4f80f873fef5756ef5f50c90aae","permalink":"https://lcolladotor.github.io/publication/2023_07_samuibrowser/","publishdate":"2023-07-12T00:00:00Z","relpermalink":"/publication/2023_07_samuibrowser/","section":"publication","summary":"High-resolution and multiplexed imaging techniques are giving us an increasingly detailed observation of a biological system. However, sharing, exploring, and customizing the visualization of large multidimensional images can be a challenge. Here, we introduce Samui, a performant and interactive image visualization tool that runs completely in the web browser. Samui is specifically designed for fast image visualization and annotation and enables users to browse through large images and their selected features within seconds of receiving a link. We demonstrate the broad utility of Samui with images generated with two platforms: Vizgen MERFISH and 10x Genomics Visium Spatial Gene Expression. Samui along with example datasets is available at https://samuibrowser.com.","tags":["spatial","HumanPilot","spatialDLPFC","SamuiBrowser"],"title":"Performant web-based interactive visualization tool for spatially-resolved transcriptomics experiments","type":"publication"},{"authors":["Louise A. Huuki-Myers","Leonardo Collado-Torres"],"categories":null,"content":" ¡Gracias Pilar @pilaralvjer \u0026amp; Cornelis @cornelisblauw for the invitation to present our work today at the 2023 NIA/LNG Neurodegenerative Diseases Seminar Series!\n🛝 by @lahuuki: https://t.co/PoiUYEFvYw\nmine: https://t.co/lUWf9jU7In#spatialDLPFC #Visium_SPG_AD @LieberInstitute pic.twitter.com/8ISp2XauVA\n— 🇲🇽 Leonardo Collado-Torres (@lcolladotor) June 9, 2023 ","date":1686268800,"expirydate":-62135596800,"kind":"page","lang":"en","lastmod":1687274640,"objectID":"660bb6a0d1266276b0c606ac12ecd8b7","permalink":"https://lcolladotor.github.io/talk/nia_lng2023/","publishdate":"2023-06-09T00:00:00Z","relpermalink":"/talk/nia_lng2023/","section":"talk","summary":"Invited seminar by Pilar Alvarez Jerez and Cornelis Blauwendraat","tags":["spatial","spatialLIBD","VistoSeg","Visium_SPG_AD"],"title":"Harnessing the power of spatially-resolved transcriptomics one step at a time","type":"talk"},{"authors":["Louise A. Huuki-Myers","Leonardo Collado-Torres"],"categories":null,"content":" Thank you #GBD23 @MinaRyten @LabGandhi John Hardy 🇬🇧 for hosting us!🙌🏽\nHopefully our #deconvochallenge #spatialLIBD #spatialDLPFC #Visium_SPG_AD work + @Bioconductor 📦s + @10xGenomics @LieberInstitute data will be useful to you@eventsWCS @UCLchildhealth @TheCrick @UCLIoN @ucl pic.twitter.com/vJcpL4tcQK\n— 🇲🇽 Leonardo Collado-Torres (@lcolladotor) May 25, 2023 ","date":1684972800,"expirydate":-62135596800,"kind":"page","lang":"en","lastmod":1687274640,"objectID":"7b9a4284cbef4456ba881ee6f8b79372","permalink":"https://lcolladotor.github.io/talk/uclion2023/","publishdate":"2023-05-25T00:00:00Z","relpermalink":"/talk/uclion2023/","section":"talk","summary":"Invited seminar by John Hardy","tags":["spatial","spatialLIBD","VistoSeg","Visium_SPG_AD"],"title":"Harnessing the power of spatially-resolved transcriptomics one step at a time","type":"talk"},{"authors":["Erik D. Nelson","Kristen R. Maynard","Kyndall R. Nicholas","Matthew N. Tran","Heena R. Divecha","Leonardo Collado-Torres","Stephanie C. Hicks \u0026dagger;","Keri Martinowich \u0026dagger;"],"categories":[],"content":"","date":1684886400,"expirydate":-62135596800,"kind":"page","lang":"en","lastmod":1708978936,"objectID":"211c24c6a9a6e99656d0621ff933a639","permalink":"https://lcolladotor.github.io/publication/2023-05_hpc_erik/","publishdate":"2023-05-24T00:00:00Z","relpermalink":"/publication/2023-05_hpc_erik/","section":"publication","summary":"Activity-regulated gene (ARG) expression patterns in the hippocampus (HPC) regulate synaptic plasticity, learning, and memory, and are linked to both risk and treatment responses for many neuropsychiatric disorders. The HPC contains discrete classes of neurons with specialized functions, but cell type-specific activity-regulated transcriptional programs are not well characterized. Here, we used single-nucleus RNA-sequencing (snRNA-seq) in a mouse model of acute electroconvulsive seizures (ECS) to identify cell type-specific molecular signatures associated with induced activity in HPC neurons. We used unsupervised clustering and a priori marker genes to computationally annotate 15,990 high-quality HPC neuronal nuclei from N = 4 mice across all major HPC subregions and neuron types. Activity-induced transcriptomic responses were divergent across neuron populations, with dentate granule cells being particularly responsive to activity. Differential expression analysis identified both upregulated and downregulated cell type-specific gene sets in neurons following ECS. Within these gene sets, we identified enrichment of pathways associated with varying biological processes such as synapse organization, cellular signaling, and transcriptional regulation. Finally, we used matrix factorization to reveal continuous gene expression patterns differentially associated with cell type, ECS, and biological processes. This work provides a rich resource for interrogating activity-regulated transcriptional responses in HPC neurons at single-nuclei resolution in the context of ECS, which can provide biological insight into the roles of defined neuronal subtypes in HPC function.","tags":["scRNAseq"],"title":"Activity-regulated gene expression across cell types of the mouse hippocampus","type":"publication"},{"authors":["Leonardo Collado-Torres"],"categories":null,"content":" Thank you #GBD23 @MinaRyten @LabGandhi John Hardy 🇬🇧 for hosting us!🙌🏽\nHopefully our #deconvochallenge #spatialLIBD #spatialDLPFC #Visium_SPG_AD work + @Bioconductor 📦s + @10xGenomics @LieberInstitute data will be useful to you@eventsWCS @UCLchildhealth @TheCrick @UCLIoN @ucl pic.twitter.com/vJcpL4tcQK\n— 🇲🇽 Leonardo Collado-Torres (@lcolladotor) May 25, 2023 ","date":1684800000,"expirydate":-62135596800,"kind":"page","lang":"en","lastmod":1687274640,"objectID":"086913567b528443d8d0bcfaebb0f7be","permalink":"https://lcolladotor.github.io/talk/crick2023/","publishdate":"2023-05-23T00:00:00Z","relpermalink":"/talk/crick2023/","section":"talk","summary":"Invited seminar by Sonia Gandhi","tags":["spatial","spatialLIBD","VistoSeg","Visium_SPG_AD","deconvolution"],"title":"Lessons from working on the edge of human brain transcriptomics with spatially-resolved transcriptomics and deconvolution","type":"talk"},{"authors":["Leonardo Collado-Torres"],"categories":null,"content":" Thank you #GBD23 @MinaRyten @LabGandhi John Hardy 🇬🇧 for hosting us!🙌🏽\nHopefully our #deconvochallenge #spatialLIBD #spatialDLPFC #Visium_SPG_AD work + @Bioconductor 📦s + @10xGenomics @LieberInstitute data will be useful to you@eventsWCS @UCLchildhealth @TheCrick @UCLIoN @ucl pic.twitter.com/vJcpL4tcQK\n— 🇲🇽 Leonardo Collado-Torres (@lcolladotor) May 25, 2023 ","date":1684713600,"expirydate":-62135596800,"kind":"page","lang":"en","lastmod":1687274640,"objectID":"ab54ce88f4d124a3674e45d54f81f966","permalink":"https://lcolladotor.github.io/talk/uclchildhealth2023/","publishdate":"2023-05-22T00:00:00Z","relpermalink":"/talk/uclchildhealth2023/","section":"talk","summary":"Invited seminar by Mina Ryten","tags":["derfinder","brainseq","recount2","recount3","spatial","spatialLIBD","VistoSeg","Visium_SPG_AD","deconvolution","Favorite"],"title":"Navigating human brain gene expression measurements at different resolutions to study psychiatric disorders","type":"talk"},{"authors":["Leonardo Collado-Torres"],"categories":null,"content":" After 10+ years of research, my FIRST 1st-author paper \u0026amp; @biorxivpreprint is finally OUT🥹I delved deep into the human inferior temporal cortex🧠in #Alzheimersdisease, using #VisiumSPG #VectraPolaris #RNAscope \u0026amp; #HALO @Indica_Labs. Check out our📜at https://t.co/QQEy1ZWc1V🔥 pic.twitter.com/dBZNzL1S96\n— Sang Ho (Sangho) Kwon (@sanghokwon17) April 24, 2023 Thank you #GBD23 @MinaRyten @LabGandhi John Hardy 🇬🇧 for hosting us!🙌🏽\nHopefully our #deconvochallenge #spatialLIBD #spatialDLPFC #Visium_SPG_AD work + @Bioconductor 📦s + @10xGenomics @LieberInstitute data will be useful to you@eventsWCS @UCLchildhealth @TheCrick @UCLIoN @ucl pic.twitter.com/vJcpL4tcQK\n— 🇲🇽 Leonardo Collado-Torres (@lcolladotor) May 25, 2023 ","date":1684281600,"expirydate":-62135596800,"kind":"page","lang":"en","lastmod":1687274640,"objectID":"44e71d56e2bf6088eaf9f2a15218e97a","permalink":"https://lcolladotor.github.io/talk/gbd2023/","publishdate":"2023-05-09T00:00:00Z","relpermalink":"/talk/gbd2023/","section":"talk","summary":"Talk at the Genomics of Brain Disorders 2023 conference","tags":["spatial","spatialLIBD","VistoSeg","Visium_SPG_AD"],"title":"Applying Visium Spatial Proteogenomics (Visium-SPG) to study Alzheimer’s Disease","type":"talk"},{"authors":[],"categories":["Conference","Ideas","Science"],"content":"I’m excited for the opportunity to participate at the #CZILatAmMtg in 2023 organized by CZI Science. I’m also thankful to those who nominated me, and in particular to Alejandra Medina Rivera. I believe that one of the reasons I’m here is for my volunteer work at the Community of Bioinformatics Software Developers in Mexico (CDSB), where many have made very important contributions. Some also know me from my time in the Bioconductor Community Advisory Board, from which I stepped down earlier this year once my 3 year term ended.\nHaving said that, I have been sharing with some other event attendees that I do feel burned out. I had envisioned that at CDSB we would train and empower those who would eventually replace us. And we’ve had quite a bit of success in doing so (3/7 CDSB board members are not founders). However, it’s been limited to a few key new volunteers, who then they risk burning out themselves. Since I want CDSB to continue on for many more years to come, I sometimes feel like I should again involve myself on organizing CDSB events. Doing so would involve volunteering on my free time. Given my position as a principal investigator, I actually spend more extra hours on activities related to that job, so I don’t have much free time to give. There are also other non-academic interests I want to pursue.\nNaturally, I want to chat with others that organize short courses through their own organizations to learn how they plan to pass on the torch and see if those ideas can apply to CDSB as well as renew my own fire. Maybe others don’t plan to pass on the torch for many years as organizing these short courses becomes part of their main job. At CDSB (and LCG-UNAM) courses, I like the path of having students in year 1, that become teaching assistants in year 2, that then teach a portion of the course in year 3, then can organize part of or a full course in year 4. But that’s a long ramp, and I think that I failed to anticipate what would happen after year 4. Like there needs to be more structure to help them continue this cycle and reach a point where they can apply for grants without the names of the founders. I also failed to notice that founders would need to be involved for a longer period of time, until we reach a larger critical mass of highly trained volunteers, which at time point can fully replace us and keep CDSB going for more years to come.\nHowever, I also have other questions and topics I want to discuss with others. For example, I’m really curious to learn about justifications others use to convince their employers to let them spend work time on these type of initiatives.\nSome arguments I’ve used are:\nWe are training the future staff we want to recruit. I learned this from a former SACNAS president and it was useful to argue for time to teach (in my case in Mexico) without having to take vacations time to do so for a week or two per year. This is one I used recently in the context of the LIBD rstats club I organize at work: “YouTube analytics tell me that we’ve had 4,621 views in the last 365 days for a total watch time of 280.7 hours. That’s an average of 5.4 hours per week, which is 13.5% of a 40 hour work week that we saved a full time employee on average per week this last year. For example, for a base salary of $x$ or $y$ that’s \u0026gt;10,000 or \u0026gt;20,000 USD in savings per year taking into account fringe costs. These videos remain in perpetuity, and while some might become outdated, they are definitely an asset for the institute.” I’m also curious to hear what arguments others use to convince their employers to let them apply to grants that limit indirect costs. For example, US-based institutions depend on those indirect costs to function, and will not like it if you apply for a grant that will limit your effort available for other grants if that grant provides, let’s say, less than 25% or 50% of the indirect costs other grants provide. Direct costs are like research costs and salary support for your team. Like if you are doing so well that you get funding for 100% of your effort, then of course institutions would like it for you to have the max indirect costs rate possible. Though well, a grant with a lower indirect costs rate is better than no grant if you don’t have 100% funded effort.\nMaybe something funding bodies could do is request that a small portion of the grantees time is used to teach communities in need for these opportunities (here we are talking about Latin America, but it could be other ones). Another idea is that they could reward with a higher indirect cost rate those institutions that allow grantees to do this during work hours. These ideas might have no legs, but maybe they could. We’ll see.\nWhile change takes a lot of effort and sometimes one might feel alone, I am definitely excited about the discussions we’ll have the next two days. Though I’m also aware of potential pitfalls, like fighting for a piece of the cake. Hopefully we can make the cake bigger!\nvia GIPHY\n","date":1681603200,"expirydate":-62135596800,"kind":"page","lang":"en","lastmod":1681700457,"objectID":"0d6b685c7fa7f6a975b69b1bab0440ae","permalink":"https://lcolladotor.github.io/2023/04/16/czi-lat-am-meeting-2023-some-questions-i-have-before-the-meeting/","publishdate":"2023-04-16T00:00:00Z","relpermalink":"/2023/04/16/czi-lat-am-meeting-2023-some-questions-i-have-before-the-meeting/","section":"post","summary":"I’m excited for the opportunity to participate at the #CZILatAmMtg in 2023 organized by CZI Science. I’m also thankful to those who nominated me, and in particular to Alejandra Medina Rivera.","tags":["Diversity","Teaching"],"title":"CZI Lat Am Meeting 2023: some questions I have before the meeting","type":"post"},{"authors":["Sonia García-Ruiz","Emil K Gustavsson","David Zhang","Regina H Reynolds","Zhongbo Chen","Aine Fairbrother-Browne","Ana Luisa Gil-Martínez","Juan A Botia","Leonardo Collado-Torres","Mina Ryten"],"categories":[],"content":"Our paper describing our database #IntroVerse is out! This is especially exciting for me as it is my first @NAR_Open paper as the first author! 🥳💫 Check it out here: https://t.co/FZzMXOvdFG 1/7 pic.twitter.com/9DmBWgOnga\n— SoniaRuiz (@sonigruiz) February 20, 2023 ","date":1668729600,"expirydate":-62135596800,"kind":"page","lang":"en","lastmod":1683619362,"objectID":"78ddfd4f62ce86af6cc9d2838c6efde9","permalink":"https://lcolladotor.github.io/publication/2023-01_introverse/","publishdate":"2022-11-18T00:00:00Z","relpermalink":"/publication/2023-01_introverse/","section":"publication","summary":"Dysregulation of RNA splicing contributes to both rare and complex diseases. RNA-sequencing data from human tissues has shown that this process can be inaccurate, resulting in the presence of novel introns detected at low frequency across samples and within an individual. To enable the full spectrum of intron use to be explored, we have developed IntroVerse, which offers an extensive catalogue on the splicing of 332,571 annotated introns and a linked set of 4,679,474 novel junctions covering 32,669 different genes. This dataset has been generated through the analysis of 17,510 human control RNA samples from 54 tissues provided by the Genotype-Tissue Expression Consortium. IntroVerse has two unique features: (i) it provides a complete catalogue of novel junctions and (ii) each novel junction has been assigned to a specific annotated intron. This unique, hierarchical structure offers multiple uses, including the identification of novel transcripts from known genes and their tissue-specific usage, and the assessment of background splicing noise for introns thought to be mis-spliced in disease states. IntroVerse provides a user-friendly web interface and is freely available at https://rytenlab.com/browser/app/introverse.","tags":["recount3","CHESS-BRAIN"],"title":"IntroVerse: a comprehensive database of introns across human tissues","type":"publication"},{"authors":["Kynon JM Benjamin","Qiang Chen","Andrew E Jaffe","Joshua M. Stolz","Leonardo Collado-Torres","Louise A. Huuki-Myers","Emily E Burke","Ria Arora","Arthur S Feltrin","André Rocha Barbosa","Eugenia Radulescu","Giulio Pergola","Joo Heon Shin","William S Ulrich","Amy Deep-Soboslay","Ran Tao","the BrainSeq Consortium","Thomas M Hyde","Joel E Kleinman","Jennifer A Erwin \u0026dagger;","Daniel R Weinberger \u0026dagger;","Apuã CM Paquola \u0026dagger;"],"categories":null,"content":" We @jerwinlab @apuapaquola @LieberInstitute submitted our manuscript entitled, “Caudate transcriptome implicates decreased presynaptic autoregulation as the dopamine risk factor for schizophrenia”, https://t.co/TjMLlUZzKJ. #Schizophrenia #BrainSeq (1/8)\n— Kynon Jade Benjamin, PhD (@kjbenjamin90) December 1, 2020 ","date":1667260800,"expirydate":-62135596800,"kind":"page","lang":"en","lastmod":1683611717,"objectID":"fa5c3562f996e8d5a0519ea9068db69d","permalink":"https://lcolladotor.github.io/publication/2022-11_bsp3/","publishdate":"2022-11-01T00:00:00Z","relpermalink":"/publication/2022-11_bsp3/","section":"publication","summary":"Most studies of gene expression in the brains of individuals with schizophrenia have focused on cortical regions, but subcortical nuclei such as the striatum are prominently implicated in the disease, and current antipsychotic drugs target the striatum’s dense dopaminergic innervation. Here, we performed a comprehensive analysis of the genetic and transcriptional landscape of schizophrenia in the postmortem caudate nucleus of the striatum of 443 individuals (245 neurotypical individuals, 154 individuals with schizophrenia and 44 individuals with bipolar disorder), 210 from African and 233 from European ancestries. Integrating expression quantitative trait loci analysis, Mendelian randomization with the latest schizophrenia genome-wide association study, transcriptome-wide association study and differential expression analysis, we identified many genes associated with schizophrenia risk, including potentially the dopamine D2 receptor short isoform. We found that antipsychotic medication has an extensive influence on caudate gene expression. We constructed caudate nucleus gene expression networks that highlight interactions involving schizophrenia risk. These analyses provide a resource for the study of schizophrenia and insights into risk mechanisms and potential therapeutic targets.","tags":["BrainSeq"],"title":"Analysis of the caudate nucleus transcriptome in individuals with schizophrenia highlights effects of antipsychotics and new risk genes","type":"publication"},{"authors":["Leonardo Collado-Torres"],"categories":null,"content":" ","date":1665014400,"expirydate":-62135596800,"kind":"page","lang":"en","lastmod":1683609557,"objectID":"e645c6a4d257808aa8392c0608281169","permalink":"https://lcolladotor.github.io/talk/rmedicine2022/","publishdate":"2022-10-06T00:00:00Z","relpermalink":"/talk/rmedicine2022/","section":"talk","summary":"Invited talk at Human Cell Atlas - Latin America 2022","tags":["spatial","HumanPilot","spatialLIBD","VistoSeg","Visium_SPG_AD"],"title":"Spatially-resolved Transcriptomics Analysis with R/Bioconductor and Beyond","type":"talk"},{"authors":["Gabriel E. Hoffman \u0026dagger;","Andrew E. Jaffe \u0026dagger;","Michael J. Gandal \u0026dagger;","Leonardo Collado-Torres","Solveig K. Sieberts","Bernie Devlin","Daniel H. Geschwind","Daniel R. Weinberger","Panos Roussos"],"categories":[],"content":"","date":1663545600,"expirydate":-62135596800,"kind":"page","lang":"en","lastmod":1683617711,"objectID":"cd509d85e6c0945243c1d2f165f2b874","permalink":"https://lcolladotor.github.io/publication/2022-09_commentary_schizophrenia/","publishdate":"2022-09-19T00:00:00Z","relpermalink":"/publication/2022-09_commentary_schizophrenia/","section":"publication","summary":"Following the recent review by Merikangas et al. summarizing differential gene expression in schizophrenia, we wanted to provide readers with our perspective on the state of the field in order to highlight current resources and ongoing challenges. We have led data collection and analysis of post mortem brains of control and schizophrenia samples across multiple large-scale cohorts, and we have provided data and results resources for each of these studies (Table 1).","tags":["bulk","BrainSeq"],"title":"Comment on: What genes are differentially expressed in individuals with schizophrenia? A systematic review","type":"publication"},{"authors":["Leonardo Collado-Torres"],"categories":null,"content":" ","date":1661385600,"expirydate":-62135596800,"kind":"page","lang":"en","lastmod":1683609557,"objectID":"f0433ad66dd0f5316396f607635ad12d","permalink":"https://lcolladotor.github.io/talk/hcala2022/","publishdate":"2022-08-25T00:00:00Z","relpermalink":"/talk/hcala2022/","section":"talk","summary":"Invited talk at R/Medicine 2022","tags":["spatial","HumanPilot","spatialLIBD","VistoSeg","Visium_SPG_AD"],"title":"Spatially-resolved Transcriptomics Analysis with R/Bioconductor and Beyond","type":"talk"},{"authors":["Leonardo Collado-Torres"],"categories":null,"content":" ","date":1658448000,"expirydate":-62135596800,"kind":"page","lang":"en","lastmod":1683608764,"objectID":"14bcc1545ae465c4072cb0982ab08d46","permalink":"https://lcolladotor.github.io/talk/montgomery2022/","publishdate":"2022-07-22T00:00:00Z","relpermalink":"/talk/montgomery2022/","section":"talk","summary":"RNA-seq Workshop at Montgomery College 2022","tags":["spatial","HumanPilot","spatialLIBD","VistoSeg","Visium_SPG_AD"],"title":"Applications, limitations, and future directions of spatial transcriptomics technology in the human brain","type":"talk"},{"authors":["Brenda Pardo","Abby Spangler","Lukas M. Weber","Stephanie C. Hicks","Andrew E. Jaffe","Keri Martinowich","Kristen R. Maynard","Leonardo Collado-Torres"],"categories":null,"content":" Our paper describing our package #spatialLIBD is finally out! 🎉🎉🎉\nspatialLIBD is an #rstats / @Bioconductor package to visualize spatial transcriptomics data.\n⁰\nThis is especially exciting for me as it is my first paper as a first author 🦑.https://t.co/COW013x4GA\n1/9 pic.twitter.com/xevIUg3IsA\n— Brenda Pardo (@PardoBree) April 30, 2021 ","date":1654905600,"expirydate":-62135596800,"kind":"page","lang":"en","lastmod":1683611044,"objectID":"63ea51a114f3418c52926b999b2ef316","permalink":"https://lcolladotor.github.io/publication/2022-06_spatiallibd/","publishdate":"2022-06-11T00:00:00Z","relpermalink":"/publication/2022-06_spatiallibd/","section":"publication","summary":"__Background__. Spatially-resolved transcriptomics has now enabled the quantification of high-throughput and transcriptome-wide gene expression in intact tissue while also retaining the spatial coordinates. Incorporating the precise spatial mapping of gene activity advances our understanding of intact tissue-specific biological processes. In order to interpret these novel spatial data types, interactive visualization tools are necessary. __Results__. We describe _spatialLIBD_, an R/Bioconductor package to interactively explore spatially-resolved transcriptomics data generated with the 10x Genomics Visium platform. The package contains functions to interactively access, visualize, and inspect the observed spatial gene expression data and data-driven clusters identified with supervised or unsupervised analyses, either on the user’s computer or through a web application. __Conclusions__. _spatialLIBD_ is available at https://bioconductor.org/packages/spatialLIBD. It is fully compatible with SpatialExperiment and the Bioconductor ecosystem. Its functionality facilitates analyzing and interactively exploring spatially-resolved data from the Visium platform.","tags":["spatial","spatialLIBD"],"title":"spatialLIBD: an R/Bioconductor package to visualize spatially-resolved transcriptomics data","type":"publication"},{"authors":["Leonardo Collado-Torres"],"categories":null,"content":" ","date":1653264000,"expirydate":-62135596800,"kind":"page","lang":"en","lastmod":1683608281,"objectID":"cf2b802bbd7134d34779de858539ec3d","permalink":"https://lcolladotor.github.io/talk/ibangs2022/","publishdate":"2022-05-23T00:00:00Z","relpermalink":"/talk/ibangs2022/","section":"talk","summary":"The International Behavioural and Neural Genetics Society (IBANGS) Transcriptomics Workshop 2022","tags":["spatial","HumanPilot","spatialLIBD","VistoSeg","Visium_SPG_AD"],"title":"Applications, limitations, and future directions of spatial transcriptomics technology in the human brain","type":"talk"},{"authors":["Leonardo Collado-Torres"],"categories":null,"content":" ","date":1652191200,"expirydate":-62135596800,"kind":"page","lang":"en","lastmod":1683613619,"objectID":"457610c6c67ab13ea202540bdff10025","permalink":"https://lcolladotor.github.io/publication/poster2022bog/","publishdate":"2022-05-10T14:00:00Z","relpermalink":"/publication/poster2022bog/","section":"publication","summary":"Poster presented at BoG2022","tags":["spatial","Visium_SPG_AD","Poster"],"title":"Spatial Transcriptomics Analysis of Aβ-tau Synergy in the Inferior Temporal Cortex of the Human Brain in Alzheimer’s Disease","type":"publication"},{"authors":null,"categories":null,"content":"Excited to share my first 🥇 first-author manuscript: \u0026#34;Data-driven Identification of Total RNA Expression Genes (TREGs) for Estimation of RNA Abundance in Heterogeneous Cell Types\u0026#34; 👩🔬 @LieberInstitute #scitwitter\nNow a @biorxivpreprint ! 🎉\n📰 https://t.co/OJuAWndW51 pic.twitter.com/VZ8xzJpcyv\n— Louise Huuki-Myers (@lahuuki) May 3, 2022 ","date":1651536000,"expirydate":-62135596800,"kind":"page","lang":"en","lastmod":1683606876,"objectID":"0ef3cc315ba90998d70677c256a81f5b","permalink":"https://lcolladotor.github.io/project/deconvolution/","publishdate":"2022-05-03T00:00:00Z","relpermalink":"/project/deconvolution/","section":"project","summary":"Deciphering proportions of cell types on human brain postmortem bulk RNA-seq data using snRNA-seq data as the reference","tags":["deconvolution","DeconvoBuddies","TREG","bulk","scRNAseq"],"title":"deconvolution","type":"project"},{"authors":["Dario Righelli __*__","Lukas M. Weber __*__","Helena L. Crowell __*__","Brenda Pardo","Leonardo Collado-Torres","Shila Ghazanfar","Aaron T. L. Lun,","Stephanie C. Hicks \u0026dagger;","Davide Risso \u0026dagger;"],"categories":null,"content":" Are you analyzing spatially-resolved transcriptomics data? Visium from @10xGenomics? You might want to use #SpatialExperiment which provides a common infrastructure fully compatible with @Bioconductor\u0026#39;s ecosystem #rstats\nMore details? Open access paper 📜https://t.co/4Y2RN4Wz2z https://t.co/49wE5Dv5HF pic.twitter.com/QpI4lvCF2r\n— 🇲🇽 Leonardo Collado-Torres (@lcolladotor) April 29, 2022 Are you working with spatial transcriptomics data such as Visium from @10xGenomics? Then you\u0026#39;ll be interested in #SpatialExperiment 📦 led by @drighelli @lmwebr @CrowellHL with contributions by @PardoBree @shazanfar A Lun @stephaniehicks @drisso1893 🌟\n📜 https://t.co/r36qlakRJe pic.twitter.com/cWIiwLFitV\n— 🇲🇽 Leonardo Collado-Torres (@lcolladotor) January 29, 2021 ","date":1651104000,"expirydate":-62135596800,"kind":"page","lang":"en","lastmod":1651436055,"objectID":"f65621ac1814bba659abc19e3ac1bc80","permalink":"https://lcolladotor.github.io/publication/2022_04_spatialexperiment/","publishdate":"2022-04-28T00:00:00Z","relpermalink":"/publication/2022_04_spatialexperiment/","section":"publication","summary":"__Summary__ SpatialExperiment is a new data infrastructure for storing and accessing spatially resolved transcriptomics data, implemented within the R/Bioconductor framework, which provides advantages of modularity, interoperability, standardized operations, and comprehensive documentation. Here, we demonstrate the structure and user interface with examples from the 10x Genomics Visium and seqFISH platforms, and provide access to example datasets and visualization tools in the STexampleData, TENxVisiumData, and ggspavis packages. __Availability and Implementation__ The SpatialExperiment, STexampleData, TENxVisiumData, and ggspavis packages are available from Bioconductor. The package versions described in this manuscript are available in Bioconductor version 3.15 onwards. __Supplementary information__ Supplementary tables and figures are available at Bioinformatics online.","tags":["spatial"],"title":"SpatialExperiment: infrastructure for spatially resolved transcriptomics data in R using Bioconductor","type":"publication"},{"authors":["Joshua M. Stolz","Nicholas J. Eagles","Louise A. Huuki-Myers","Leonardo Collado-Torres"],"categories":null,"content":"For an overview of our recent work, check this video and companion slides.\n","date":1650412800,"expirydate":-62135596800,"kind":"page","lang":"en","lastmod":1683607173,"objectID":"16bb2ee0bbd57b60f1dcf2ed604fef2f","permalink":"https://lcolladotor.github.io/talk/teamtldr2022/","publishdate":"2022-04-20T00:00:00Z","relpermalink":"/talk/teamtldr2022/","section":"talk","summary":"For an overview of our recent work, check this video and companion slides.","tags":["Nextflow","PopTop","SPEAQeasy","BiocMAP","LIBD Data Portal","scRNAseq","deconvolution","DeconvoBuddies","TREG","tensorQTL","qsvaR","bulk","DGE","spatial","GitHub","Favorite"],"title":"R/Bioconductor-powered Team Data Science (TLDR 2022)","type":"talk"},{"authors":["Leonardo Collado-Torres","Louise A. Huuki-Myers"],"categories":null,"content":" ","date":1646265600,"expirydate":-62135596800,"kind":"page","lang":"en","lastmod":1683609557,"objectID":"416e1be3450fc92889a235998f17b5b6","permalink":"https://lcolladotor.github.io/talk/psychgenomics2022/","publishdate":"2022-03-03T00:00:00Z","relpermalink":"/talk/psychgenomics2022/","section":"talk","summary":"Invited seminar at Psychgenomics, Ichan School of Medicine","tags":["deconvolution","DeconvoBuddies","TREG"],"title":"Deconvolution of RNA-seq data in the postmortem human brain: the present and preparing the future","type":"talk"},{"authors":["Peter P. Zandi","Andrew E. Jaffe","Fernando S. Goes","Emily E. Burke","Leonardo Collado-Torres","Louise A. Huuki-Myers","Arta Seyedian","Yian Lin","Fayaz Seifuddin","Mehdi Pirooznia","Christopher A. Ross","Joel E. Kleinman","Daniel R. Weinberger","Thomas M. Hyde \u0026dagger;"],"categories":[],"content":"Zandi doesn\u0026#39;t have an account here, so there\u0026#39;s no Twitter 🧵 on a recent paper he led @jhugeneticepi @LieberInstitute#BipSeq: bulk #RNAseq from the amygdala \u0026amp; sACC🧠 from #bipolar disorder donors\n💻https://t.co/t9JiL6CeJb\n📢https://t.co/fjRIkrhsTn\n📜https://t.co/dhdYaQtPLX https://t.co/K8F5gppBTj\n— 🇲🇽 Leonardo Collado-Torres (@lcolladotor) May 1, 2022 https://twitter.com/lcolladotor/status/\n","date":1646092800,"expirydate":-62135596800,"kind":"page","lang":"en","lastmod":1683596554,"objectID":"a7e889d4f6d45e27b4017bf747433673","permalink":"https://lcolladotor.github.io/publication/2022_03_zandi-amygdala/","publishdate":"2022-03-07T00:00:00Z","relpermalink":"/publication/2022_03_zandi-amygdala/","section":"publication","summary":"Recent genetic studies have identified variants associated with bipolar disorder (BD), but it remains unclear how brain gene expression is altered in BD and how genetic risk for BD may contribute to these alterations. Here, we obtained transcriptomes from subgenual anterior cingulate cortex and amygdala samples from post-mortem brains of individuals with BD and neurotypical controls, including 511 total samples from 295 unique donors. We examined differential gene expression between cases and controls and the transcriptional effects of BD-associated genetic variants. We found two coexpressed modules that were associated with transcriptional changes in BD: one enriched for immune and inflammatory genes and the other with genes related to the postsynaptic membrane. Over 50% of BD genome-wide significant loci contained significant expression quantitative trait loci (QTL) (eQTL), and these data converged on several individual genes, including SCN2A and GRIN2A. Thus, these data implicate specific genes and pathways that may contribute to the pathology of BD.","tags":["Bipolar disorder","Gene expression profiling"],"title":"Amygdala and anterior cingulate transcriptomes from individuals with bipolar disorder reveal downregulated neuroimmune and synaptic pathways","type":"publication"},{"authors":["Giovanna Punzi","Gianluca Ursini","Qiang Chen","Eugenia Radulescu","Ran Tao","Louise A. Huuki-Myers","Pasquale Di Carlo","Leonardo Collado-Torres","Joo Heon Shin","Roberto Catanesi","Andrew E. Jaffe","Thomas M. Hyde","Joel E. Kleinman","Trudy F.C. Mackay","Daniel R. Weinberger \u0026dagger;"],"categories":[],"content":"Lieber Institute researchers examine the #genomics and #transcriptomics of #suicide in the latest edition of the American Journal of Psychiatry. There’s no treatment specific to suicide—but our scientists hope to change that. https://t.co/nRHkzL7CxL\n— Lieber Institute (@LieberInstitute) March 3, 2022 ","date":1646092800,"expirydate":-62135596800,"kind":"page","lang":"en","lastmod":1683596554,"objectID":"4223d1997434b69287427825d511c9c7","permalink":"https://lcolladotor.github.io/publication/2022_03_punzi-genetics/","publishdate":"2022-03-03T00:00:00Z","relpermalink":"/publication/2022_03_punzi-genetics/","section":"publication","summary":"Objective: The authors sought to study the transcriptomic and genomic features of completed suicide by parsing the method chosen, to capture molecular correlates of the distinctive frame of mind of individuals who die by suicide, while reducing heterogeneity. Methods: The authors analyzed gene expression (RNA sequencing) from postmortem dorsolateral prefrontal cortex of patients who died by suicide with violent compared with nonviolent means, nonsuicide patients with the same psychiatric disorders, and a neurotypical group (total N=329). They then examined genomic risk scores (GRSs) for each psychiatric disorder included, and GRSs for cognition (IQ) and for suicide attempt, testing how they predict diagnosis or traits (total N=888). Results: Patients who died by suicide by violent means showed a transcriptomic pattern remarkably divergent from each of the other patient groups but less from the neurotypical group; consistently, their genomic profile of risk was relatively low for their diagnosed illness as well as for suicide attempt, and relatively high for IQ: they were more similar to the neurotypical group than to other patients. Differentially expressed genes (DEGs) associated with patients who died by suicide by violent means pointed to purinergic signaling in microglia, showing similarities to a genome-wide association study of Drosophila aggression. Weighted gene coexpression network analysis revealed that these DEGs were coexpressed in a context of mitochondrial metabolic activation unique to suicide by violent means. Conclusions: These findings suggest that patients who die by suicide by violent means are in part biologically separable from other patients with the same diagnoses, and their behavioral outcome may be less dependent on genetic risk for conventional psychiatric disorders and be associated with an alteration of purinergic signaling and mitochondrial metabolism.","tags":["Genomic Risk","Mitochondria","Postmortem Brain","Purinergic Signaling","RNA Sequencing","Suicide Method"],"title":"Genetics and Brain Transcriptomics of Completed Suicide","type":"publication"},{"authors":["Christopher Wilks","Shijie C. Zheng","Feng Yong Chen","Rone Charles","Brad Solomon","Jonathan P. Ling","Eddie Luidy Imada","David Zhang","Lance Joseph","Jeffrey T. Leek","Andrew E. Jaffe","Abhinav Nellore","Leonardo Collado-Torres","Kasper D. Hansen \u0026dagger;","Ben Langmead \u0026dagger;"],"categories":null,"content":" Check out recount3 now out in Genome Biology! https://t.co/aFZWEweFk6… and get the data here: https://t.co/DSvfyN7VEv. 750,000 (!!!) public RNA-seq samples processed and ready for scienceing! Amazing work from @chrisnwilks @BenLangmead @KasperDHansen @lcolladotor\n— Jeff Leek (@jtleek) November 29, 2021 Beyond pleased to have the recount3 preprint out: https://t.co/rgYIEayhAQ. It\u0026#39;s a long time coming, involving total rebuild of our analysis infrastructure and heroic efforts from @chrisnwilks, @lcolladotor, @KasperDHansen and others. 1/6\n— Ben Langmead (@BenLangmead) May 24, 2021 ","date":1638144000,"expirydate":-62135596800,"kind":"page","lang":"en","lastmod":1651425968,"objectID":"6b9c0e6f393b2aa92e582d83b99523bc","permalink":"https://lcolladotor.github.io/publication/2021_11_recount3/","publishdate":"2021-11-29T00:00:00Z","relpermalink":"/publication/2021_11_recount3/","section":"publication","summary":"We present recount3, a resource consisting of over 750,000 publicly available human and mouse RNA sequencing (RNA-seq) samples uniformly processed by our new Monorail analysis pipeline. To facilitate access to the data, we provide the recount3 and snapcount R/Bioconductor packages as well as complementary web resources. Using these tools, data can be downloaded as study-level summaries or queried for specific exon-exon junctions, genes, samples, or other features. Monorail can be used to process local and/or private data, allowing results to be directly compared to any study in recount3. Taken together, our tools help biologists maximize the utility of publicly available RNA-seq data, especially to improve their understanding of newly collected data. recount3 is available from http://rna.recount.bio.","tags":["recount3"],"title":"recount3: summaries and queries for large-scale RNA-seq expression and splicing","type":"publication"},{"authors":["Matthew N. Tran __*__","Kristen R. Maynard __*__","Abby Spangler","Louise A. Huuki-Myers","Kelsey D. Montgomery","Vijay Sadashivaiah","Madhavi Tippani","Brianna K. Barry","Dana B. Hancock","Stephanie C. Hicks","Joel E. Kleinman","Thomas M. Hyde","Leonardo Collado-Torres","Andrew E. Jaffe \u0026dagger;","Keri Martinowich \u0026dagger;"],"categories":null,"content":" IT\u0026#39;S FINALLY OUT!! 🧠🧬🤩 Single-nucleus transcriptome analysis reveals cell-type-specific molecular signatures across reward circuitry in the human brain, in @NeuroCellPress - coauthored with @kr_maynard:https://t.co/XCcnUQ6o3h\n— Matthew N Tran (@mattntran) September 27, 2021 Dropping our preprint for profiling the single-nucleus transcriptome across the reward circuitry in the human brain, co-authored by @kr_maynard and myself! 🧠https://t.co/JoNeprGP7X\n— Matthew N Tran (@mattntran) October 8, 2020 ","date":1633478400,"expirydate":-62135596800,"kind":"page","lang":"en","lastmod":1683596554,"objectID":"a1c269086019511324496ff02448bb27","permalink":"https://lcolladotor.github.io/publication/2021_10_matt_snrnaseq/","publishdate":"2021-10-06T00:00:00Z","relpermalink":"/publication/2021_10_matt_snrnaseq/","section":"publication","summary":"Single-cell gene expression technologies are powerful tools to study cell types in the human brain, but efforts have largely focused on cortical brain regions. We therefore created a single-nucleus RNA-sequencing resource of 70,615 high-quality nuclei to generate a molecular taxonomy of cell types across five human brain regions that serve as key nodes of the human brain reward circuitry: nucleus accumbens, amygdala, subgenual anterior cingulate cortex, hippocampus, and dorsolateral prefrontal cortex. We first identified novel subpopulations of interneurons and medium spiny neurons (MSNs) in the nucleus accumbens and further characterized robust GABAergic inhibitory cell populations in the amygdala. Joint analyses across the 107 reported cell classes revealed cell-type substructure and unique patterns of transcriptomic dynamics. We identified discrete subpopulations of D1- and D2-expressing MSNs in the nucleus accumbens to which we mapped cell-type-specific enrichment for genetic risk associated with both psychiatric disease and addiction.","tags":["snRNA-seq"],"title":"Single-nucleus transcriptome analysis reveals cell-type-specific molecular signatures across reward circuitry in the human brain","type":"publication"},{"authors":["Leonardo Collado-Torres"],"categories":null,"content":" ","date":1632873600,"expirydate":-62135596800,"kind":"page","lang":"en","lastmod":1683608265,"objectID":"b68420373a47ed5c04475aead99efe31","permalink":"https://lcolladotor.github.io/talk/spatialbiology2021/","publishdate":"2021-09-29T00:00:00Z","relpermalink":"/talk/spatialbiology2021/","section":"talk","summary":"Spatial Biology US 2021","tags":["spatial","HumanPilot","spatialLIBD","Bioconductor","VistoSeg"],"title":"Extending Spatial Analysis with R/Bioconductor and beyond","type":"talk"},{"authors":["Kira A. Perzel Mandell","Nicholas J. Eagles","Richard Wilton","Amanda J. Price","Stephen A. Semick","Leonardo Collado-Torres","William S. Ulrich","Ran Tao","Shizhong Han","Alexander S. Szalay","Thomas M. Hyde","Joel E. Kleinman","Daniel R. Weinberger \u0026dagger;","Andrew E. Jaffe \u0026dagger;"],"categories":null,"content":" My latest paper is out in @NatureComms! We establish a single-base resolution view of the relationship between genetic variation and DNA methylation in the brain, and show how this can be used to better understand GWAS findings for schizophreniahttps://t.co/8juZlOjyAc\n— Kira PM, PhD (@Kira_P_M) September 2, 2021 Excited to share the most comprehensive analysis to date of the associations between genetic variation and DNA methylation in the human brain! meQTLs are extensive throughout the genome and can likely be used to further understand GWAS risk variants:https://t.co/HGVUhtxPsi\n— Kira PM, PhD (@Kira_P_M) September 25, 2020 ","date":1630540800,"expirydate":-62135596800,"kind":"page","lang":"en","lastmod":1683596554,"objectID":"2953ba516d5d238093fd98c49abd1c6e","permalink":"https://lcolladotor.github.io/publication/2021_09_kira_wgbs/","publishdate":"2021-09-02T00:00:00Z","relpermalink":"/publication/2021_09_kira_wgbs/","section":"publication","summary":"DNA methylation (DNAm) is an epigenetic regulator of gene expression and a hallmark of gene-environment interaction. Using whole-genome bisulfite sequencing, we have surveyed DNAm in 344 samples of human postmortem brain tissue from neurotypical subjects and individuals with schizophrenia. We identify genetic influence on local methylation levels throughout the genome, both at CpG sites and CpH sites, with 86% of SNPs and 55% of CpGs being part of methylation quantitative trait loci (meQTLs). These associations can further be clustered into regions that are differentially methylated by a given SNP, highlighting the genes and regions with which these loci are epigenetically associated. These findings can be used to better characterize schizophrenia GWAS-identified variants as epigenetic risk variants. Regions differentially methylated by schizophrenia risk-SNPs explain much of the heritability associated with risk loci, despite covering only a fraction of the genomic space. We provide a comprehensive, single base resolution view of association between genetic variation and genomic methylation, and implicate schizophrenia GWAS-associated variants as influencing the epigenetic plasticity of the brain.","tags":["DNAm"],"title":"Genome-wide sequencing-based identification of methylation quantitative trait loci and their role in schizophrenia risk","type":"publication"},{"authors":["Leonardo Collado-Torres"],"categories":null,"content":" ","date":1628467200,"expirydate":-62135596800,"kind":"page","lang":"en","lastmod":1683603458,"objectID":"4a12b803c4a21c02be7cfebdd87522a2","permalink":"https://lcolladotor.github.io/talk/cdsb2021/","publishdate":"2021-08-09T00:00:00Z","relpermalink":"/talk/cdsb2021/","section":"talk","summary":"Inaugural talk for kickstarting the CDSB2021 workshops.","tags":["CDSB"],"title":"Launch of CDSB2021","type":"talk"},{"authors":[],"categories":["Misc","sports"],"content":"Yesterday there was a controversy because the Mexican Women’s softball team at the Tokyo 2020 Olympics (Wikipedia, Instagram) threw several uniforms and equipment to the trash (source: ESPN). Right now I’m really disappointed with the negative reaction and personal attacks against the members of said team. At the same time, I don’t want to remain silent so I decided to write this post.\nImagine that you live outside of your ancestral country. People see you differently and tell you to go back to the country you came from. This is a reality that inmigrants around the world live through frequently, including Mexicans and their descendants in the US. If this happens to you, it can generate a strong internal reaction. Descendents from inmigrants have to learn to live with and adjust to their multiple identities. In my experience it’s a gradient and I see it with friends that just arrived to the US from Mexico, people like myself who have been in the US for years, those who inmigrated to the US as children, and those who are descendants (2nd generation and beyond). Everyone is different and each one of us identifies with their cultural roots in different ways.\nView this post on Instagram A post shared by Anissa Urtez (@nniiiss)\nThat’s why the experience of Anissa Urtez, one of the members of this team ^[Why Anissa Urtez? She’s the one that shared the most detailed information of what happened through her Instagram stories. Furthermore, Anissa was selected to the ideal women’s softball team for the Tokyo 2020 Olympics.], that she describes of growing as an American with Mexican ancestors where she wasn’t considered Mexican enough, American enough, and with brown skin, is totally valid and complicated. If six years ago she decided to be part of a low resources project that aimed to build a Mexican Women’s softball team that could celeberate winning a match, participate in tournaments, win enough in the 2019 Pan Aamerican Games to classify to the Olympics for the first time ever, we have to thank her and value her effort, time, energy, and all that she dedicated towards making this dream a reality. Her participation at the Tokyo 2020 Olympics was never guaranteed.\nView this post on Instagram A post shared by Anissa Urtez (@nniiiss)\nAnd they made this dream a reality. As a mexican I’m overwhelmed with emotion and pride ❤️ when I see how they celebrated classifying to the Olympics by beating the Canadian team 2-1. Regrettably they would end up losing the bronze medal match against the same team in Tokyo 2020.\nView this post on Instagram A post shared by Anissa Urtez (@nniiiss)\nSo I’m now filled with sadness to see how the people in power are asking to get them suspended for life and/or take legal action against them because they threw away some uniforms with the Mexican flag (ESPN). They recognized that it was a mistake.\nView this post on Instagram A post shared by Anissa Urtez (@nniiiss)\nBut I strongly think that this wasn’t their mistake only. It was a communication error from the administration if they didn’t explain to them the expectations that:\nthey had to return all the equipment with them without any logistics or financial support to do so the bed covers were not a present like they thought the uniforms hold such a strong emotional value, even those that they didn’t actually use during the Olympics The administration should have defended them and supported them instead of using them as a piñata and a distraction. Now part of the public is dedicated to attacking them just like Trump attacked/attacks Mexicans (whether they are American or not): that they aren’t Mexicans, that they should leave, that no one wants them, etc. Even some Olympic athletes, that have represented or represent Mexico, have an attitude of: if it was hard for me, it should be hard for you too. That’s the same attitude that I see in the academic realm that is used to make minorities suffer when they already have to fight with less resources for the opportunities others have. It’s an attitude of crushing each other instead of supporting each other so we can fix and learn from our mistakes and grow together.\nSo my open letter to Anissa Urtez and the rest of the Mexican Women’s softball team from the Tokyo 2020 Olympics is:\nThank you Anissa for representing us with pride and for all the countless hours of effort and sacrifice that you’ve dedicated to this sport and this team.\nAll Mexicans are humans and humans make mistakes. At a distance it’s clear to me that there was an error in communication and in setting expectations from the part of the administration. If the administration wasn’t going to support you to cover the additional baggage expenses, if they expected you to carry back all your uniforms and equipment, if they knew about the mattress cover, etc, they should have told you so. They should have tried to protect you and your teammates as much as possible and they completely failed you.\nYou concentrated on performing well on your …","date":1627603200,"expirydate":-62135596800,"kind":"page","lang":"en","lastmod":1689109377,"objectID":"fabc2ea57f6bbde892d70318ded58b25","permalink":"https://lcolladotor.github.io/2021/07/30/tokyo2020-mexico-softball-controversy/","publishdate":"2021-07-30T00:00:00Z","relpermalink":"/2021/07/30/tokyo2020-mexico-softball-controversy/","section":"post","summary":"Yesterday there was a controversy because the Mexican Women’s softball team at the Tokyo 2020 Olympics (Wikipedia, Instagram) threw several uniforms and equipment to the trash (source: ESPN). Right now I’m really disappointed with the negative reaction and personal attacks against the members of said team.","tags":["Diversity","immigration","politics","olympics"],"title":"I'm disappointed by the reaction against the Tokyo 2020 Mexican Women Softball team","type":"post"},{"authors":["Leonardo Collado-Torres"],"categories":null,"content":" ","date":1626048000,"expirydate":-62135596800,"kind":"page","lang":"en","lastmod":1683603458,"objectID":"8f9e0dd4e828874d21ef5e64676c5aad","permalink":"https://lcolladotor.github.io/talk/nihds2021/","publishdate":"2021-07-12T00:00:00Z","relpermalink":"/talk/nihds2021/","section":"talk","summary":"NIH Data Science Bootcamp: Finding Data Panel","tags":["recount2","recount3","HumanPilot"],"title":"NIH DS bootcamp: finding data panel","type":"talk"},{"authors":["Leonardo Collado-Torres"],"categories":null,"content":" ","date":1623024000,"expirydate":-62135596800,"kind":"page","lang":"en","lastmod":1683603458,"objectID":"e755bbcd39d13da7baff2d7296f0b162","permalink":"https://lcolladotor.github.io/talk/hbhl2021/","publishdate":"2021-06-07T00:00:00Z","relpermalink":"/talk/hbhl2021/","section":"talk","summary":"HBHL 2021 Keynote","tags":["spatial","HumanPilot"],"title":"Studying the Topography of Spatial Gene Expression in the Human Brain","type":"talk"},{"authors":null,"categories":null,"content":"","date":1620950400,"expirydate":-62135596800,"kind":"page","lang":"en","lastmod":1683606876,"objectID":"86a3a05b6263c1c3ddac4d04760c34ad","permalink":"https://lcolladotor.github.io/project/recount3/","publishdate":"2021-05-14T00:00:00Z","relpermalink":"/project/recount3/","section":"project","summary":"recount3: summaries and queries for large-scale RNA-seq expression and splicing","tags":["recount3","bulk"],"title":"recount3","type":"project"},{"authors":["Leonardo Collado-Torres"],"categories":null,"content":"OSCA slides were adapted from material by Peter Hickey.\n","date":1620000000,"expirydate":-62135596800,"kind":"page","lang":"en","lastmod":1683603458,"objectID":"d148ec3c1b93517ebf04ceed0236e805","permalink":"https://lcolladotor.github.io/talk/hcala2021/","publishdate":"2021-05-03T00:00:00Z","relpermalink":"/talk/hcala2021/","section":"talk","summary":"Human Cell Atlas workshop presentation based on OSCA and material by Peter Hickey.","tags":["OSCA"],"title":"Getting started with scRNA-seq analyses with Bioconductor","type":"talk"},{"authors":["Nicholas J. Eagles","Emily E. Burke","Jacob Leonard","Brianna K. Barry","Joshua M. Stolz","Louise A. Huuki-Myers","BaDoi N. Phan","Violeta Larios Serrato","Everardo Gutiérrez-Millán","Israel Aguilar-Ordoñez","Andrew E. Jaffe","Leonardo Collado-Torres"],"categories":null,"content":" Congrats Nick https://t.co/O3u5XRPXy2 for your @biorxivpreprint first pre-print! 🙌🏽\nSPEAQeasy is our @nextflowio implementation of the #RNAseq processing pipeline that produces @Bioconductor-friendly #rstats objects that we use at @LieberInstitute\n📜 https://t.co/zKuBRtBCmY pic.twitter.com/F83fXI90eP\n— 🇲🇽 Leonardo Collado-Torres (@lcolladotor) December 12, 2020 ","date":1619827200,"expirydate":-62135596800,"kind":"page","lang":"en","lastmod":1683596554,"objectID":"81da6918c06d073016798d8ad3cc00dc","permalink":"https://lcolladotor.github.io/publication/2021_05_speaqeasy/","publishdate":"2021-05-01T00:00:00Z","relpermalink":"/publication/2021_05_speaqeasy/","section":"publication","summary":"__Background__. RNA sequencing (RNA-seq) is a common and widespread biological assay, and an increasing amount of data is generated with it. In practice, there are a large number of individual steps a researcher must perform before raw RNA-seq reads yield directly valuable information, such as differential gene expression data. Existing software tools are typically specialized, only performing one step–such as alignment of reads to a reference genome–of a larger workflow. The demand for a more comprehensive and reproducible workflow has led to the production of a number of publicly available RNA-seq pipelines. However, we have found that most require computational expertise to set up or share among several users, are not actively maintained, or lack features we have found to be important in our own analyses. __Results__. In response to these concerns, we have developed a Scalable Pipeline for Expression Analysis and Quantification (SPEAQeasy), which is easy to install and share, and provides a bridge towards R/Bioconductor downstream analysis solutions. SPEAQeasy is portable across computational frameworks (SGE, SLURM, local, docker integration) and different configuration files are provided (http://research.libd.org/SPEAQeasy/). __Conclusions__. SPEAQeasy is user-friendly and lowers the computational-domain entry barrier for biologists and clinicians to RNA-seq data processing as the main input file is a table with sample names and their corresponding FASTQ files. The goal is to provide a flexible pipeline that is immediately usable by researchers, regardless of their technical background or computing environment.","tags":["BrainSeq"],"title":"SPEAQeasy: a scalable pipeline for expression analysis and quantification for R/Bioconductor-powered RNA-seq analyses","type":"publication"},{"authors":["Leonardo Collado-Torres"],"categories":null,"content":" ","date":1619481600,"expirydate":-62135596800,"kind":"page","lang":"en","lastmod":1687274640,"objectID":"6c2f113e1b063dbe65944a18e372cb93","permalink":"https://lcolladotor.github.io/talk/bioturing2021/","publishdate":"2021-04-27T00:00:00Z","relpermalink":"/talk/bioturing2021/","section":"talk","summary":"BioTuring webinar presented along with Kristen R Maynard from the Lieber Institute for Brain Development.","tags":["spatial","HumanPilot"],"title":"BioTuring webinar","type":"talk"},{"authors":["David Zhang","Regina H. Reynolds","Sonia Garcia-Ruiz","Emil K Gustavsson","Sid Sethi","Sara Aguti","Ines A. Barbosa","Jack J. Collier","Henry Houlden","Robert McFarland","Francesco Muntoni","Monika Oláhová","Joanna Poulton","Michael Simpson","Robert D.S. Pitceathly","Robert W. Taylor","Haiyan Zhou","Charu Deshpande","Juan A. Botia","Leonardo Collado-Torres","Mina Ryten"],"categories":null,"content":" This week was very intense but lots of new #rstats 📦 goodies are now under review at @Bioconductor 🤞🏽#biocthis https://t.co/p3vu5DxRsi#recount3 https://t.co/ogg7QFm0gq#megadepth \u0026amp; #dasper https://t.co/AFRs6nVt1a\nCongrats on your 1st \u0026amp; 2nd 📦 submission @dyzhang32!! 🤩 pic.twitter.com/mMYDEnzUL8\n— 🇲🇽 Leonardo Collado-Torres (@lcolladotor) October 2, 2020 ","date":1616976000,"expirydate":-62135596800,"kind":"page","lang":"en","lastmod":1651425968,"objectID":"01778c6e13cbb08bfb88f1a3b3aa05df","permalink":"https://lcolladotor.github.io/publication/preprint_dasper/","publishdate":"2021-03-29T00:00:00Z","relpermalink":"/publication/preprint_dasper/","section":"publication","summary":"Although next-generation sequencing technologies have accelerated the discovery of novel gene-to-disease associations, many patients with suspected Mendelian diseases still leave the clinic without a genetic diagnosis. An estimated one third of these patients will have disorders caused by mutations impacting splicing. RNA-sequencing has been shown to be a promising diagnostic tool, however few methods have been developed to integrate RNA-sequencing data into the diagnostic pipeline. Here, we introduce dasper, an R/Bioconductor package that improves upon existing tools for detecting aberrant splicing by using machine learning to incorporate disruptions in exon-exon junction counts as well as coverage. dasper is designed for diagnostics, providing a rank-based report of how aberrant each splicing event looks, as well as including visualization functionality to facilitate interpretation. We validate dasper using 16 patient-derived fibroblast cell lines harbouring pathogenic variants known to impact splicing. We find that dasper is able to detect pathogenic splicing events with greater accuracy than existing LeafCutterMD or z-score approaches. Furthermore, by only applying a broad OMIM gene filter (without any variant-level filters), dasper is able to detect pathogenic splicing events within the top 10 most aberrant identified for each patient. Since using publicly available control data minimises costs associated with incorporating RNA-sequencing into diagnostic pipelines, we also investigate the use of 504 GTEx fibroblast samples as controls. We find that dasper leverages publicly available data effectively, ranking pathogenic splicing events in the top 25. Thus, we believe dasper can increase diagnostic yield for a pathogenic splicing variants and enable the efficient implementation of RNA-sequencing for diagnostics in clinical laboratories.","tags":["recount2"],"title":"Detection of pathogenic splicing events from RNA-sequencing data using dasper","type":"publication"},{"authors":["Nicholas E. Clifton","Leonardo Collado-Torres","Emily E. Burke","Antonio F. Pardiñas","Janet C. Harwood","Arianna Di Florio","James T. R. Walters","Michael J. Owen","Michael C. O’Donovan","Daniel R. Weinberger","Peter A. Holmans","Andrew E. Jaffe \u0026dagger;","Jeremy Hall \u0026dagger;"],"categories":null,"content":" Published and proofed. Our @neurosciencecu / @LieberInstitute collaboration looks at developmental susceptibility to psychiatric genetic risk among voltage-gated calcium and potassium channel activity pathwayshttps://t.co/Qa8i8BTenG\n— Nicholas Clifton (@NE_Clifton) May 7, 2021 ","date":1615420800,"expirydate":-62135596800,"kind":"page","lang":"en","lastmod":1651425968,"objectID":"18649d7157f401a8ce879226ce97e4af","permalink":"https://lcolladotor.github.io/publication/2021_03_clifton/","publishdate":"2021-03-11T00:00:00Z","relpermalink":"/publication/2021_03_clifton/","section":"publication","summary":"__Background__. Recent breakthroughs in psychiatric genetics have implicated biological pathways onto which genetic risk for psychiatric disorders converges. However, these studies do not reveal the developmental time point(s) at which these pathways are relevant. __Methods__. We aimed to determine the relationship between psychiatric risk and developmental gene expression relating to discrete biological pathways. We used postmortem RNA sequencing data (BrainSeq and BrainSpan) from brain tissue at multiple prenatal and postnatal time points, with summary statistics from recent genome-wide association studies of schizophrenia, bipolar disorder, and major depressive disorder. We prioritized gene sets for overall enrichment of association with each disorder and then tested the relationship between the association of their constituent genes with their relative expression at each developmental stage. __Results__. We observed relationships between the expression of genes involved in voltage-gated cation channel activity during early midfetal, adolescence, and early adulthood time points and association with schizophrenia and bipolar disorder, such that genes more strongly associated with these disorders had relatively low expression during early midfetal development and higher expression during adolescence and early adulthood. The relationship with schizophrenia was strongest for the subset of genes related to calcium channel activity, while for bipolar disorder, the relationship was distributed between calcium and potassium channel activity genes. __Conclusions__. Our results indicate periods during development when biological pathways related to the activity of calcium and potassium channels may be most vulnerable to the effects of genetic variants conferring risk for psychiatric disorders. Furthermore, they indicate key time points and potential targets for disorder-specific therapeutic interventions.","tags":["BrainSeq"],"title":"Developmental Profile of Psychiatric Risk Associated With Voltage-Gated Cation Channel Activity","type":"publication"},{"authors":["Christopher Wilks","Omar Ahmed","Daniel N Baker","David Zhang","Leonardo Collado-Torres","Ben Langmead"],"categories":null,"content":" Megadepth: fast quantification of interval sets w/r/t BigWigs \u0026amp; BAMs. Command-line \u0026amp; Bioconductor interfaces: https://t.co/6rq6cFhLtu. Github: https://t.co/vAcWCTrN4P. Great work, @chrisnwilks, @oyfahmed, @lcolladotor, @dyzhang32, @dnb_hopkins. 1/2 https://t.co/ogcOFYpVN2\n— Ben Langmead (@BenLangmead) December 18, 2020 ","date":1615161600,"expirydate":-62135596800,"kind":"page","lang":"en","lastmod":1651425968,"objectID":"083441a6c9f5e450ff95f4bc544939f5","permalink":"https://lcolladotor.github.io/publication/2021_03_megadepth/","publishdate":"2021-03-08T00:00:00Z","relpermalink":"/publication/2021_03_megadepth/","section":"publication","summary":"__Motivation__. A common way to summarize sequencing datasets is to quantify data lying within genes or other genomic intervals. This can be slow and can require different tools for different input file types. __Results__. Megadepth is a fast tool for quantifying alignments and coverage for BigWig and BAM/CRAM input files, using substantially less memory than the next-fastest competitor. Megadepth can summarize coverage within all disjoint intervals of the Gencode V35 gene annotation for more than 19 000 GTExV8 BigWig files in approximately 1 h using 32 threads. Megadepth is available both as a command-line tool and as an R/Bioconductor package providing much faster quantification compared to the rtracklayer package. __Availability and implementation__: https://github.com/ChristopherWilks/megadepth, https://bioconductor.org/packages/megadepth.","tags":null,"title":"Megadepth: efficient coverage quantification for BigWigs and BAMs","type":"publication"},{"authors":["Kristen R Maynard __*__","[__Leonardo Collado-Torres__](/authors/admin) __*__","Lukas M. Weber","Cedric Uytingco","Brianna K. Barry","Stephen R. Williams","Joseph L. Catallini II","Matthew N. Tran","Zachary Besich","Madhavi Tippani","Jennifer Chew","Yifeng Yin","Joel E. Kleinman","Thomas M. Hyde","Nikhil Rao","Stephanie C. Hicks","Keri Martinowich \u0026dagger;","Andrew E Jaffe \u0026dagger;"],"categories":null,"content":" pleased to announce that this paper is now out in @NatureNeuro : https://t.co/m5L1YvETzN ! check out full text here: https://t.co/zMdMTA5QG4 . congrats to @kr_maynard @lcolladotor @lmwebr @stephaniehicks and @martinowk and other investigators at @LieberInstitute \u0026amp; @10xGenomics https://t.co/StYedlFMHc\n— Andrew Jaffe (@andrewejaffe) February 8, 2021 🔥off the press! 👀 our @biorxivpreprint on human 🧠brain @LieberInstitute spatial 🌌🔬transcriptomics data 🧬using Visium @10xGenomics🎉#spatialLIBD\n🔍https://t.co/RTW0VscUKR 👩🏾💻https://t.co/bsg04XKONr\n📚https://t.co/FJDOOzrAJ6\n📦https://t.co/Au5jwADGhYhttps://t.co/PiWEDN9q2N pic.twitter.com/aWy0yLlR50\n— 🇲🇽 Leonardo Collado-Torres (@lcolladotor) February 29, 2020 ","date":1612742400,"expirydate":-62135596800,"kind":"page","lang":"en","lastmod":1683603458,"objectID":"93fb634c002b93e3184cf95a3250b264","permalink":"https://lcolladotor.github.io/publication/2021_02_spatiallibd/","publishdate":"2021-02-08T00:00:00Z","relpermalink":"/publication/2021_02_spatiallibd/","section":"publication","summary":"We used the 10x Genomics Visium platform to define the spatial topography of gene expression in the six-layered human dorsolateral prefrontal cortex. We identified extensive layer-enriched expression signatures and refined associations to previous laminar markers. We overlaid our laminar expression signatures on large-scale single nucleus RNA-sequencing data, enhancing spatial annotation of expression-driven clusters. By integrating neuropsychiatric disorder gene sets, we showed differential layer-enriched expression of genes associated with schizophrenia and autism spectrum disorder, highlighting the clinical relevance of spatially defined expression. We then developed a data-driven framework to define unsupervised clusters in spatial transcriptomics data, which can be applied to other tissues or brain regions in which morphological architecture is not as well defined as cortical laminae. Last, we created a web application for the scientific community to explore these raw and summarized data to augment ongoing neuroscience and spatial transcriptomics research (http://research.libd.org/spatialLIBD).","tags":["spatial","spatialLIBD","HumanPilot"],"title":"Transcriptome-scale spatial gene expression in the human dorsolateral prefrontal cortex","type":"publication"},{"authors":["Leonardo Collado-Torres"],"categories":null,"content":" ","date":1611792000,"expirydate":-62135596800,"kind":"page","lang":"en","lastmod":1683603458,"objectID":"d3e2a2d7bd1b82a77ddc7d7b6efe15e0","permalink":"https://lcolladotor.github.io/talk/cdcrug2021/","publishdate":"2021-01-28T00:00:00Z","relpermalink":"/talk/cdcrug2021/","section":"talk","summary":"Guest presentation for the CDC/ATSDR R User Group on spatialLIBD and recount3","tags":["spatial","recount3","HumanPilot","spatialLIBD"],"title":"CDC/ATSDR R User Group","type":"talk"},{"authors":["Leonardo Collado-Torres"],"categories":null,"content":" ","date":1611792000,"expirydate":-62135596800,"kind":"page","lang":"en","lastmod":1621020950,"objectID":"f9e432f3cb2c7ea602faa263513715e4","permalink":"https://lcolladotor.github.io/talk/conectar2021/","publishdate":"2021-01-28T00:00:00Z","relpermalink":"/talk/conectar2021/","section":"talk","summary":"Virtual poster for the ConectaR2021 conference about biocthis (in Spanish).","tags":["biocthis"],"title":"ConectaR2021","type":"talk"},{"authors":["Leonardo Collado-Torres"],"categories":null,"content":" ","date":1604534400,"expirydate":-62135596800,"kind":"page","lang":"en","lastmod":1621020950,"objectID":"28511ebc31f08d94bed29bf6b2e8fc31","permalink":"https://lcolladotor.github.io/talk/tab2020/","publishdate":"2020-11-05T00:00:00Z","relpermalink":"/talk/tab2020/","section":"talk","summary":"Guest presentation for the Bioconductor Technical Advisory Board","tags":["biocthis"],"title":"Bioconductor Technical Advisory Board","type":"talk"},{"authors":[],"categories":["rstats"],"content":"Today was an unusual day at work given the US Elections. This meant that I had fewer meetings than what I’ve had lately. Earlier in the day I noticed an email announcing that the Bioconductor 3.13 docker image had been released for the next 6 month development cycle, which was a reminder of the recent Bioconductor 3.12 release. This prompted me to start updating my R packages.\nIn the past, I’ve updated all my currently installed R packages using the framework I described in a 2017 blog post. I remember seeing a tweet by Hadley Wickham not so long ago 1 that for him, a new R version was an opportunity to start with a clean slate. I like having everything I need ready to use, but well, my list of installed R packages was getting pretty long. Given that 4 year windows of time are in our minds, it felt like a good opportunity to clean my house. Or well, my R packages.\nThus, I started writing down which are the packages I want to have installed. At this point for me, that includes several R/Bioconductor packages I’ve made and their dependencies in case I need to work on them to resolve bugs or add new features. My R packages already use many of my favorite R packages, so I took advantage of this in order to avoid having to list every single R package I like using. In order to achieve this, I used the dependencies = TRUE argument that you can use with remotes and BiocManager.\n## Install from scratch if (!requireNamespace(\u0026#34;remotes\u0026#34;, quietly = TRUE)) install.packages(\u0026#34;remotes\u0026#34;) remotes::install_cran(\u0026#34;BiocManager\u0026#34;) BiocManager::version() ## Rprofile packages remotes::install_github(c( \u0026#34;jalvesaq/colorout\u0026#34; )) remotes::install_cran(c( \u0026#34;devtools\u0026#34;, \u0026#34;usethis\u0026#34; )) ## Main packages BiocManager::install(c( \u0026#34;biocthis\u0026#34;, \u0026#34;brainflowprobes\u0026#34;, \u0026#34;derfinder\u0026#34;, \u0026#34;derfinderPlot\u0026#34;, \u0026#34;GenomicState\u0026#34;, \u0026#34;megadepth\u0026#34;, \u0026#34;recount\u0026#34;, \u0026#34;recountWorkflow\u0026#34;, \u0026#34;recount3\u0026#34;, \u0026#34;regutools\u0026#34;, \u0026#34;regionReport\u0026#34;, \u0026#34;spatialLIBD\u0026#34; ), dependencies = TRUE, update = FALSE) Once I had my main packages, I started adding some from LIBD, some from CRAN, and other ones from Bioconductor. You can see the full list at my team’s website under Config files: R setup; R packages.\nI was curious about how these changes affected my list of installed R packages and used my older 2017 blog post code to check this. That resulted in this list which shows 423 installed R packages and 589 that I used to have installed. I suspect that several of them will come back. For example, I needed to install blogdown to work on this blog post. Some of the 423 packages are new, like rsthemes which we recently learned about at the LIBD rstats club.\nToday @lcolladotor went over new @rstudio \u0026amp; @Bioconductor developments that was started by tweets by @apreshill \u0026amp; @grrrck + new #rstats 📦s #recount3 #megadepth involving @chrisnwilks @dyzhang32 et al\n📹https://t.co/E0DZ9Ej5qV\n📓 https://t.co/FnDvcUmyUO\n👀https://t.co/mEbQirhkF6 pic.twitter.com/BWByp9W7Wh\n— LIBD rstats club (@LIBDrstats) October 3, 2020 Config files Since I was doing all this work on both my macOS and Windows laptops for my R setup, I also went ahead and cleaned up a bit my configuration files. I have several of them with settings that I recommend others to use. That’s why I wrote a little “chapter” about them on my team’s website. The list includes:\nSoftware I use (including R and RStudio) R packages R configuration files such as ~/.Rprofile and ~/.Renviron Git configuration files ~/.gitconfig and ~/.gitignore_global JHPCE (linux) configuration files such as ~/.bashrc, ~/.inputrc, ~/.bash_profile and ~/.sge_request Wrapping up I’m hoping that all this information will be useful to both current and new team members, but it could be useful also to you. Though you might need to adapt some things. Earlier on in my career I learned from how others use configuration files to speed up their work or make their work experience more enjoyable. I’m still learning, but now I have a decent bag of tricks to share too.\nHave fun!\nImage source\nAcknowledgments This blog post was made possible thanks to:\nBiocStyle (Oleś, 2023) blogdown (Xie, Hill, and Thomas, 2017) knitcitations (Boettiger, 2021) sessioninfo (Wickham, Chang, Flight, Müller et al., 2021) References \\[1\\] C. Boettiger. knitcitations: Citations for ‘Knitr’ Markdown Files. R package version 1.0.12. 2021. URL: https://CRAN.R-project.org/package=knitcitations. \\[2\\] A. Oleś. BiocStyle: Standard styles for vignettes and other Bioconductor documents. R package version 2.28.0. 2023. DOI: 10.18129/B9.bioc.BiocStyle. URL: https://bioconductor.org/packages/BiocStyle. \\[3\\] H. Wickham, W. Chang, R. Flight, K. Müller, et al. sessioninfo: R Session Information. R package version 1.2.2. 2021. URL: https://CRAN.R-project.org/package=sessioninfo. \\[4\\] Y. Xie, A. P. Hill, and A. Thomas. blogdown: Creating Websites with R Markdown. Boca Raton, Florida: Chapman and Hall/CRC, 2017. ISBN: 978-0815363729. URL: https://bookdown.org/yihui/blogdown/. Reproducibility ## ─ Session info …","date":1604361600,"expirydate":-62135596800,"kind":"page","lang":"en","lastmod":1689109377,"objectID":"9843aff9b09fa056f513f90334327dee","permalink":"https://lcolladotor.github.io/2020/11/03/cleaning-up-my-r-packages-and-config-files/","publishdate":"2020-11-03T00:00:00Z","relpermalink":"/2020/11/03/cleaning-up-my-r-packages-and-config-files/","section":"post","summary":"Today was an unusual day at work given the US Elections. This meant that I had fewer meetings than what I’ve had lately. Earlier in the day I noticed an email announcing that the Bioconductor 3.","tags":["Bioconductor"],"title":"Cleaning up my R packages and config files","type":"post"},{"authors":[],"categories":["LIBD","rstats"],"content":"Today I have accepted a new role at the Lieber Institute for Brain Development (LIBD) as an Investigator. Since LIBD is affiliated with Johns Hopkins University (JHU), LIBD will support me on becoming a JHU faculty member ^[The rules are Department and School specific at JHU, which is something that I have yet to explore in detail.]. This change means that I’ll now be leading a team at LIBD, which is why I’m actively working on a new website ^[It’s technically a book made using bookdown.] called R/Bioconductor-powered Team Data Science. On that website I’m implementing the ideas I recently proposed on another type of data science group which involve Data Science guidance sessions based on my three year experience as a teaching assistant for the MPH capstone at JHBSPH.\nI also plan to make publicly available as much material as we can. This will include a series of bootcamps that I’m going to start running today for my team members and guests. It will also include our team journal/software club presentations as well as the LIBD rstats club presentations. The material that I’ll be using was made by many collaborators and friends at JHU, Harvard, WEHI, RStudio and the rstats community in general. I’m really thankful that so many people have shared their educational materials in ways that can be re-used and for making it easier for all of us to learn from them. Thank you!\nBeyond the 20% education and data science guidance efforts, my team will be working with our LIBD peers, JHU collaborators, and external allies on interesting research projects such as the teamSpatial ^[Keri Martinowich, Kristen Maynard, Stephanie Hicks, and their team members.] that developed #spatialLIBD, #recount3, and many other upcoming projects in the realms of RNA-seq, R/Bioconductor, and genomics. We will be developing methods and software, analyzing data, and aim to build a stronger bridge between LIBD and JHU.\nI’m really thankful to everyone who has been a part of my journey: mentors, colleagues, allies, sponsors, and many friends. I want to highlight my mentors Jeff Leek and Andrew Jaffe without whom I wouldn’t be where I am right now. They’ve always been my fiercest advocates and have looked out for me all these years. It’s now my turn to try have a positive influence in others, though they set a very high bar! I have a lot to learn and work to do, but I’m looking forward to it. At LIBD, JHU and elsewhere I have many people I can ask for support, which I’m grateful for.\nFinally, after reading Jeff Leek’s How to be a modern scientist book in preparation for the first bootcamp today, I’ve updated my Twitter username to match my GitHub one. That is, I’ve gone from fellgernon to lcolladotor. See you around on Twitter and elsewhere!\nP.S. If you find this type of team and the work that we do appealing, let me know and we’ll evaluate what options are available =)\nAcknowledgments This blog post was made possible thanks to:\nBiocStyle (Oleś, 2023) blogdown (Xie, Hill, and Thomas, 2017) knitcitations (Boettiger, 2021) sessioninfo (Wickham, Chang, Flight, Müller et al., 2021) R/Bioconductor-powered Team Data Science was made possible thanks to bookdown and a GitHub Actions workflow that depends on Bioconductor’s docker image, which in turn depends on the Rocker Project.\nbookdown (Xie, 2016) References [1] C. Boettiger. knitcitations: Citations for \u0026#39;Knitr\u0026#39; Markdown Files. R package version 1.0.12. 2021. URL: https://CRAN.R-project.org/package=knitcitations.\n[2] A. Oleś. BiocStyle: Standard styles for vignettes and other Bioconductor documents. R package version 2.28.0. 2023. DOI: 10.18129/B9.bioc.BiocStyle. URL: https://bioconductor.org/packages/BiocStyle.\n[3] H. Wickham, W. Chang, R. Flight, K. Müller, et al. sessioninfo: R Session Information. R package version 1.2.2. 2021. URL: https://CRAN.R-project.org/package=sessioninfo.\n[4] Y. Xie. bookdown: Authoring Books and Technical Documents with R Markdown. Boca Raton, Florida: Chapman and Hall/CRC, 2016. ISBN: 978-1138700109. URL: https://bookdown.org/yihui/bookdown.\n[5] Y. Xie, A. P. Hill, and A. Thomas. blogdown: Creating Websites with R Markdown. Boca Raton, Florida: Chapman and Hall/CRC, 2017. ISBN: 978-0815363729. URL: https://bookdown.org/yihui/blogdown/.\nReproducibility ## ─ Session info ─────────────────────────────────────────────────────────────────────────────────────────────────────── ## setting value ## version R version 4.3.1 (2023-06-16) ## os macOS Ventura 13.4 ## system aarch64, darwin20 ## ui X11 ## language (EN) ## collate en_US.UTF-8 ## ctype en_US.UTF-8 ## tz America/New_York ## date 2023-07-11 ## pandoc 3.1.5 @ /opt/homebrew/bin/ (via rmarkdown) ## ## ─ Packages ─────────────────────────────────────────────────────────────────────────────────────────────────────────── ## package * version date (UTC) lib source ## backports 1.4.1 2021-12-13 [1] CRAN (R 4.3.0) ## bibtex 0.5.1 2023-01-26 [1] CRAN (R 4.3.0) ## BiocManager 1.30.21 2023-06-10 [1] CRAN (R 4.3.0) ## BiocStyle * …","date":1600646400,"expirydate":-62135596800,"kind":"page","lang":"en","lastmod":1689109377,"objectID":"aae89042388f36bc551e9b95f02fd6f3","permalink":"https://lcolladotor.github.io/2020/09/21/the-start-of-a-new-phase-for-me/","publishdate":"2020-09-21T00:00:00Z","relpermalink":"/2020/09/21/the-start-of-a-new-phase-for-me/","section":"post","summary":"Today I have accepted a new role at the Lieber Institute for Brain Development (LIBD) as an Investigator. Since LIBD is affiliated with Johns Hopkins University (JHU), LIBD will support me on becoming a JHU faculty member ^[The rules are Department and School specific at JHU, which is something that I have yet to explore in detail.","tags":["Academia","Industry","rstats"],"title":"The start of a new phase for me","type":"post"},{"authors":["Leonardo Collado-Torres"],"categories":null,"content":" ","date":1599696000,"expirydate":-62135596800,"kind":"page","lang":"en","lastmod":1621020950,"objectID":"ccf88a248eb01f2c76cbffda38ec1e01","permalink":"https://lcolladotor.github.io/talk/ryten2020/","publishdate":"2020-09-10T00:00:00Z","relpermalink":"/talk/ryten2020/","section":"talk","summary":"Guest presentation for Mina Ryten's lab on biocthis.","tags":["recount3","biocthis"],"title":"Ryten lab","type":"talk"},{"authors":["Leonardo Collado-Torres"],"categories":null,"content":" ","date":1596499200,"expirydate":-62135596800,"kind":"page","lang":"en","lastmod":1621020950,"objectID":"6829e841a43d8f9efcfad0e6b8c738af","permalink":"https://lcolladotor.github.io/talk/jsm2020/","publishdate":"2020-08-04T00:00:00Z","relpermalink":"/talk/jsm2020/","section":"talk","summary":"Presentation about our work at CDSB for the JSM 2020 session organized by Stephanie Hicks; Show Me the Data: Making Statistics and Data Science More Diverse and Inclusive in 2020.","tags":["CDSB","Favorite"],"title":"Promoting the next wave of R/Bioconductor developers in Latin America starting in Mexico","type":"talk"},{"authors":["Leonardo Collado-Torres"],"categories":null,"content":" ","date":1596412800,"expirydate":-62135596800,"kind":"page","lang":"en","lastmod":1621020950,"objectID":"f9dd0c8c76e1b4e33d3cbfbdbe701dc7","permalink":"https://lcolladotor.github.io/talk/cdsb2020/","publishdate":"2020-08-03T00:00:00Z","relpermalink":"/talk/cdsb2020/","section":"talk","summary":"Inaugural talk for kickstarting the CDSB2020 workshop.","tags":["CDSB"],"title":"Launch of CDSB2020","type":"talk"},{"authors":["Leonardo Collado-Torres"],"categories":null,"content":" ","date":1596045600,"expirydate":-62135596800,"kind":"page","lang":"en","lastmod":1683613619,"objectID":"c53e48ac75d14a5549a671acccbc2493","permalink":"https://lcolladotor.github.io/publication/poster2020bioc/","publishdate":"2020-07-29T13:00:00-05:00","relpermalink":"/publication/poster2020bioc/","section":"publication","summary":"Poster on the HumanPilot project for BioC2020 using spatialLIBD.","tags":["spatial","Poster","HumanPilot","spatialLIBD"],"title":"Transcriptome-scale spatial gene expression in the human dorsolateral prefrontal cortex","type":"publication"},{"authors":["Leonardo Collado-Torres"],"categories":null,"content":" ","date":1595980800,"expirydate":-62135596800,"kind":"page","lang":"en","lastmod":1621020950,"objectID":"f9fd46331536b412977368fcb4db709b","permalink":"https://lcolladotor.github.io/talk/bioc2020cdsb/","publishdate":"2020-07-29T00:00:00Z","relpermalink":"/talk/bioc2020cdsb/","section":"talk","summary":"CDSB BoF for BioC2020","tags":["CDSB"],"title":"BioC2020 Birds of a Feather on the CDSB community","type":"talk"},{"authors":["Leonardo Collado-Torres"],"categories":null,"content":" ","date":1595808000,"expirydate":-62135596800,"kind":"page","lang":"en","lastmod":1621020950,"objectID":"30c8920dba81ba1bb0086827cf2f6569","permalink":"https://lcolladotor.github.io/talk/bioc2020/","publishdate":"2020-07-27T00:00:00Z","relpermalink":"/talk/bioc2020/","section":"talk","summary":"recount workshop for BioC2020","tags":["recount2"],"title":"BioC2020 recount workshop","type":"talk"},{"authors":["Kira A Perzel Mandell","Amanda J Price","Richard Wilton","Leonardo Collado-Torres","Ran Tao","Nicholas J. Eagles","Alexander S Szalay","Thomas M Hyde","Daniel R Weinberger","Joel E Kleinman","Andrew E Jaffe \u0026dagger;"],"categories":null,"content":" Congrats @Kira_P_M on your 1st tweet \u0026amp; @biorxivpreprint 📜 ^_^! + welcome to #SciTwitter🤗\n👀Check it out if you are interested in #DNAm from #WGBS data from the prenatal human brain 🧠 cortex. + follow Kira from @andrewejaffe\u0026#39;s lab at @LieberInstitutehttps://t.co/lAtvTfpc9A pic.twitter.com/PszVS6HaAO\n— 🇲🇽 Leonardo Collado-Torres (@lcolladotor) November 5, 2019 ","date":1594771200,"expirydate":-62135596800,"kind":"page","lang":"en","lastmod":1683596554,"objectID":"ff461f208a4f1261a2fccb9d8e839b25","permalink":"https://lcolladotor.github.io/publication/2020-07_kira_prenatal/","publishdate":"2020-07-15T00:00:00Z","relpermalink":"/publication/2020-07_kira_prenatal/","section":"publication","summary":"DNA methylation (DNAm) is a key epigenetic regulator of gene expression across development. The developing prenatal brain is a highly dynamic tissue, but our understanding of key drivers of epigenetic variability across development is limited. We, therefore, assessed genomic methylation at over 39 million sites in the prenatal cortex using whole-genome bisulfite sequencing and found loci and regions in which methylation levels are dynamic across development. We saw that DNAm at these loci was associated with nearby gene expression and enriched for enhancer chromatin states in prenatal brain tissue. Additionally, these loci were enriched for genes associated with neuropsychiatric disorders and genes involved with neurogenesis. We also found autosomal differences in DNAm between the sexes during prenatal development, though these have less clear functional consequences. We lastly confirmed that the dynamic methylation at this critical period is specifically CpG methylation, with generally low levels of CpH methylation. Our findings provide detailed insight into prenatal brain development as well as clues to the pathogenesis of psychiatric traits seen later in life.","tags":["DNAm"],"title":"Characterizing the dynamic and functional DNA methylation landscape in the developing human cortex","type":"publication"},{"authors":["Yoichi Araki","Ingie Hong","Timothy R Gamache","Shaowen Ju","Leonardo Collado-Torres","Joo Heon Shin","Richard L Huganir \u0026dagger;"],"categories":null,"content":" Guess what protein is packed so densely into synapses that it looks like early X-mas? Which isoform of this protein is most critical for mental health? Our paper with @yoichi_araki @JooHeonSHIN @fellgernon @andrewejaffe @Dr_Weinberger @rhuganir is finally out! https://t.co/z41h6kfi9p\n— Ingie Hong (@Ih_current) July 1, 2020 ","date":1592956800,"expirydate":-62135596800,"kind":"page","lang":"en","lastmod":1651425968,"objectID":"2a23239b481ca21b34a61c4ba0cb38ab","permalink":"https://lcolladotor.github.io/publication/2020-06_syngap/","publishdate":"2020-06-24T00:00:00Z","relpermalink":"/publication/2020-06_syngap/","section":"publication","summary":"SynGAP is a synaptic Ras GTPase-activating protein (GAP) with four C-terminal splice variants: α1, α2, β, and γ. Although studies have implicated SYNGAP1 in several cognitive disorders, it is not clear which SynGAP isoforms contribute to disease. Here, we demonstrate that SynGAP isoforms exhibit unique spatiotemporal expression patterns and play distinct roles in neuronal and synaptic development in mouse neurons. SynGAP-α1, which undergoes liquid-liquid phase separation with PSD-95, is highly enriched in synapses and is required for LTP. In contrast, SynGAP-β, which does not bind PSD-95 PDZ domains, is less synaptically targeted and promotes dendritic arborization. A mutation in SynGAP-α1 that disrupts phase separation and synaptic targeting abolishes its ability to regulate plasticity and instead causes it to drive dendritic development like SynGAP-β. These results demonstrate that distinct intrinsic biochemical properties of SynGAP isoforms determine their function, and individual isoforms may differentially contribute to the pathogenesis of SYNGAP1-related cognitive disorders.","tags":["BrainSeq"],"title":"SynGAP isoforms differentially regulate synaptic plasticity and dendritic development","type":"publication"},{"authors":["Joselyn Chávez","Carmina Barberena-Jonas","Jesus E Sotelo-Fonseca","José Alquicira-Hernández","Heladia Salgado","[__Leonardo Collado-Torres__](/authors/admin) \u0026dagger;","Alejandro Reyes \u0026dagger;"],"categories":null,"content":" The #regutools paper has been published by @OUPBioinfo. Thanks for your excellent work @BarjonCar, @josschavezf1, @EmilianoSotel10, @fellgernon, et al. First paper result of our efforts to increase the representation of #latam @Bioconductor developers. https://t.co/By1dEgxtGy https://t.co/WWsAYZ7KHM\n— Alejandro Reyes (@areyesq) June 24, 2020 ","date":1592870400,"expirydate":-62135596800,"kind":"page","lang":"en","lastmod":1651425968,"objectID":"efccad6bfe13b7c0ee9062448ca70da2","permalink":"https://lcolladotor.github.io/publication/2020-06_regutools/","publishdate":"2020-06-23T00:00:00Z","relpermalink":"/publication/2020-06_regutools/","section":"publication","summary":"RegulonDB has collected, harmonized and centralized data from hundreds of experiments for nearly two decades and is considered a point of reference for transcriptional regulation in Escherichia coli K12. Here, we present the regutools R package to facilitate programmatic access to RegulonDB data in computational biology. regutools gives researchers the possibility of writing reproducible workflows with automated queries to RegulonDB. The regutools package serves as a bridge between RegulonDB data and the Bioconductor ecosystem by reusing the data structures and statistical methods powered by other Bioconductor packages. We demonstrate the integration of regutools with Bioconductor by analyzing transcription factor DNA binding sites and transcriptional regulatory networks from RegulonDB. We anticipate that regutools will serve as a useful building block in our progress to further our understanding of gene regulatory networks.","tags":[""],"title":"Programmatic access to bacterial regulatory networks with regutools","type":"publication"},{"authors":["Leonardo Collado-Torres"],"categories":null,"content":"Check the companion R Consortium blog post.\n","date":1592524800,"expirydate":-62135596800,"kind":"page","lang":"en","lastmod":1621020950,"objectID":"5b01169d7015836e5709c8caba3c3b7d","permalink":"https://lcolladotor.github.io/talk/user2020/","publishdate":"2020-06-19T00:00:00Z","relpermalink":"/talk/user2020/","section":"talk","summary":"Check the companion R Consortium blog post.","tags":["CDSB"],"title":"Latin American Communities and Organizations","type":"talk"},{"authors":["David Zhang __*__","Sebastian Guelfi __*__","Sonia Garcia Ruiz","Beatrice Costa","Regina H Reynolds","Karishma D'Sa","Wenfei Liu","Thomas Courtin","Amy Peterson","Andrew E Jaffe","John Hardy","Juan Botia","Leonardo Collado-Torres","Mina Ryten"],"categories":null,"content":" Occasionally I encounter researchers, who suggest bulk RNA-seq transcriptomics is \u0026#34;sort\u0026#34; of solved, human annotation is \u0026#34;sort\u0026#34; of complete, and it\u0026#39;s probably not worth spending long hours in looking into novel isoforms, splicing events: For them https://t.co/6NBYOz9OZP 1/2 pic.twitter.com/9LMAOo24KA\n— Hirak Sarkar @[email protected] (@hrksrkr) June 12, 2020 Welcome to #academic twitter David Zhang! 🙌🏽🥳\nHe’s an awesome researcher and excellent at translating ideas into #rstats code as well as beautiful figures! 🤩\n@DavidZh03027445\nHe is the co-lead author of our recent preprint https://t.co/VVr9Qfm6R7\nI bet many PIs will 👀 him!\n— 🇲🇽 Leonardo Collado-Torres (@lcolladotor) February 5, 2019 ","date":1591747200,"expirydate":-62135596800,"kind":"page","lang":"en","lastmod":1651425968,"objectID":"6dc3e92ff4b432e11bcac253139610f2","permalink":"https://lcolladotor.github.io/publication/2020-06_omimderfinder/","publishdate":"2020-06-10T00:00:00Z","relpermalink":"/publication/2020-06_omimderfinder/","section":"publication","summary":"Growing evidence suggests that human gene annotation remains incomplete; however, it is unclear how this affects different tissues and our understanding of different disorders. Here, we detect previously unannotated transcription from Genotype-Tissue Expression RNA sequencing data across 41 human tissues. We connect this unannotated transcription to known genes, confirming that human gene annotation remains incomplete, even among well-studied genes including 63% of the Online Mendelian Inheritance in Man–morbid catalog and 317 neurodegeneration-associated genes. We find the greatest abundance of unannotated transcription in brain and genes highly expressed in brain are more likely to be reannotated. We explore examples of reannotated disease genes, such as SNCA, for which we experimentally validate a previously unidentified, brain-specific, potentially protein-coding exon. We release all tissue-specific transcriptomes through vizER: http://rytenlab.com/browser/app/vizER. We anticipate that this resource will facilitate more accurate genetic analysis, with the greatest impact on our understanding of Mendelian and complex neurogenetic disorders.","tags":["derfinder"],"title":"Incomplete annotation has a disproportionate impact on our understanding of Mendelian and complex neurogenetic disorders","type":"publication"},{"authors":["Leonardo Collado-Torres"],"categories":null,"content":" ","date":1584628200,"expirydate":-62135596800,"kind":"page","lang":"en","lastmod":1683603458,"objectID":"956682c11095138c7b427966d7d4e1d8","permalink":"https://lcolladotor.github.io/talk/scientist2020/","publishdate":"2020-03-19T14:30:00Z","relpermalink":"/talk/scientist2020/","section":"talk","summary":"Webinar for The Scientist sponsored by 10x Genomics. Approximately 600 individuals registered for the webinar and you can watch it on demand. I presented this talk at LIIGH-UNAM 2020 for LCG-EJ-UNAM students and during the CDSB2020 workshop.","tags":["spatial","HumanPilot","spatialLIBD"],"title":"Transcriptome-Scale Spatial Gene Expression in the Human Dorsolateral Prefrontal Cortex","type":"talk"},{"authors":[],"categories":["Computing"],"content":" Oh ohh! 😱 What do you do now? The data me and my colleagues work with is typically too big for our personal computers, so we use a high performance computing environment (cluster) and mostly interact with it through the command line terminal. As you might know, I’m a big fan of version control and I use git plus GitHub for sharing our code ^[Between our personal computers and the JHPCE cluster, but also with collaborators and the community at large.]. That’s why I’ve been advocating others to use it for a while and when they do, they run to me if they have some issues. A while back, my former student Amy Peterson wrote a blog post titled git to know git: an 8 minute introduction which is useful if you are getting started. Amy also links to the excellent Happy Git and GitHub for the useR book.\nRecurrent problem: you just commited a large file and can’t push to GitHub One situation that I’ve frequently helped others with is when they use git add * or git add . and version control every file in their project. They then do a commit such as git commit -m \u0026#34;added all files\u0026#34; and run git push to sync their files to GitHub. But oops, GitHub complains that you are trying to commit files larger than 50 Mb and even grinds to a halt if they are larger than 100 Mb. Which given that we work with large data, happens frequently (even a PDF file can be that big!).\nOk, so what can you do at this point? Remember, this is the scenario where you just made that commit. That is, it’s the last commit. At that point, it’s best to undo your last git commit which is well described in this website. However, when you undo a commit, you can either fully wipe out any changes (wipe them out fully from your disk, not only git’s version control!) or undo the version control step but also keep your files intact. The main solution then is to use:\ngit reset --soft HEAD~1 However, maybe you tried other commands and it’s a bit more complicated than that. Which is why I greatly advise that you create a local backup of your main_project directory before you dive into commands such as git reset, specially whenever you see the --hard option being suggested. That is, do something like this:\n## Nagivate to the parent directory of your main_project cd directory_containing_your_project ## Check the full size of your project directory du -sh main_project ## Do you have enough disk space? df -h . ## If you have enough disk space, then create a full backup cp -r main_project main_project_backup/ Once you are able to roll back the offending commit, instead of running git add * or git add . and similar commands, repeat the following cycle:\nCheck which files are not being version controlled (untracked) with git status. Check how big each of your untracked files is. You can do so with ls -lh and ls -lh some_pattern. Add the files or file patterns you want to avoid version controlling (the large files) to your .gitignore file ^[Note that you can also create .gitignore files inside each directory if you want to have tighter control. You could also ignore a full directory and the use git add -f to forcibly version control files, for example, echo \u0026#34;my_subdir\u0026#34; \u0026gt;\u0026gt; .gitignore plus git add -f my_subdir/*.R to forcibly version control the R script files inside my_subdir but ignore everything else.]. Double check that your pattern worked by confirming that these files do not show up as untracked when you run git status. Repeat this until the only remaining untracked files are those you actually want to version control and that are small enough ^[If you really want to version control large files, look into git lfs.].\nAnd that’s it! Keep version controlling your code and reap the benefits later on when you need to.\nvia GIPHY\nWe all run into this situation at some point (or multiple times), so please keep using version control. The benefits will outweigh the negatives!\nUse case story: the issue Thanks to a colleague who gave me permission to share their use case, here we can dive down into a real life example. First, this was their description (edited for anonymity):\nRan these, as per GitHub’s instructions, and it went fine\ngit init git add README.md git commit -m \u0026#34;first commit\u0026#34; git remote add origin [email protected]:LieberInstitute/some_repository.git git push -u origin master Even added a .gitignore with some instructions on what to ignore when committing\nBut it wasn’t enough and I hadn’t come to appreciate yet that there’s no need to commit .rda’s or other very large files, so my git push died.\nSince these were already staged, I thought the next move was to make another commit with an edited .gitignore listing anything in my rdas/\nPutting me two branches ahead of master (Leo: commits I think)\nI got frustrated and thought then that ok, I want to go back two commits…\nmy Googling suggested me to go for git reset --hard HEAD~2…\nThat’s when I started panicking 😭\nMy colleague started panicking at this point because they couldn’t see the files anymore. That is, running ls -lh …","date":1584489600,"expirydate":-62135596800,"kind":"page","lang":"en","lastmod":1689109377,"objectID":"4dd21a320eb4a32b6cfe6457bef4af24","permalink":"https://lcolladotor.github.io/2020/03/18/you-just-committed-a-large-file-and-can-t-push-to-github/","publishdate":"2020-03-18T00:00:00Z","relpermalink":"/2020/03/18/you-just-committed-a-large-file-and-can-t-push-to-github/","section":"post","summary":"Oh ohh! 😱 What do you do now? The data me and my colleagues work with is typically too big for our personal computers, so we use a high performance computing environment (cluster) and mostly interact with it through the command line terminal.","tags":["Git","github"],"title":"You just committed a large file and can't push to GitHub","type":"post"},{"authors":["Andrew E Jaffe __*__ \u0026dagger;","Daniel J Hoeppner __*__","Takeshi Saito","Lou Blanpain","Joy Ukaigwe","Emily E Burke","Leonardo Collado-Torres","Ran Rato","Katsunori Tajinda","Kristen R Maynard","Matthew N Tran","Keri Martinowich","Amy Deep-Soboslay","Joo Heon Shin","Joel E Kleinman","Daniel R Weinberger","Mitsuyuki Matsumoto \u0026dagger;","Thomas M Hyde \u0026dagger;"],"categories":null,"content":" while we\u0026#39;re all dealing with this COVID19 outbreak right now, I\u0026#39;m happy to share our latest work on identifying expression quantitative trait loci (eQTLs) and other molecular associations (age + psychiatric diagnoses) in an important cell population in the human brain (1/n) https://t.co/FJQcnzvvE7\n— Andrew Jaffe (@andrewejaffe) March 17, 2020 ","date":1584316800,"expirydate":-62135596800,"kind":"page","lang":"en","lastmod":1651425968,"objectID":"158018bfc413c9c58fa0489ce92b27e1","permalink":"https://lcolladotor.github.io/publication/2020-03_dglcm/","publishdate":"2020-03-16T00:00:00Z","relpermalink":"/publication/2020-03_dglcm/","section":"publication","summary":"Jaffe et al. profile the granule cell layer of the human hippocampus and find unique molecular associations for aging and genetic variation, as well as diagnosis with schizophrenia and its genetic risk, that were previously undiscovered in homogenate tissue.","tags":["BrainSeq"],"title":"Profiling gene expression in the human dentate gyrus granule cell layer reveals insights into schizophrenia and its genetic risk","type":"publication"},{"authors":[],"categories":["rstats","Science","LIBD"],"content":" After a long start to 2020 including the past four very busy weeks, I’m happy to announce that today March 16th 2020 I accepted a position as Research Scientist at the Lieber Institute for Brain Development in Baltimore, MD, USA.\nvia GIPHY\nWhat will I do as a Research Scientist at LIBD? At LIBD we currently have the following scientific ranks:\nResearch Technician Research Assistant Research Associate Staff Scientist I, II and III Research Scientist (+ Lead and Senior) Investigator (+ Lead and Senior) Research Scientists carry out research, do so scholarly, are tasked with being creative, are encouraged to seek funding, and can have supervisory and mentor roles.\nIn my agreement with LIBD, I will remain affiliated with the Data Science Team I led by Andrew E Jaffe while also having the opportunity to interact with and collaborate with fantastic biologists, data scientists, and researchers at LIBD, Johns Hopkins University, and beyond. Furthermore, I will officially help mentor LIBD scientists in data science and R tools. LIBD will support me while I build a small team around my research interests and prepare my first set of grant submissions. There will be a transition period and many things I need to learn: from requesting a budget to writing a job ad, as well as many details about grant requests. But ultimately, LIBD offered me a launch pad for an academic career.\nvia GIPHY\nDetails One of my first tasks will be to refine the details of my role. For example, right now on the teaching side of things I’m imagining doing the following:\nLead a weekly LIBD rstats club meeting where I can go over topics common to several users. Hold one-on-one data science guidance sessions, similar to the MPH capstone sessions I did during my teaching assistant years at JHBSPH. Occasionally lead internal workshops, which could benefit from workshops I prepare for CDSB and elsewhere. Get certified by RStudio and attend more R conferences \u0026amp; workshops. From the scientific side, I will also learn more about the biological questions my LIBD colleagues are working on. These hypothesis-driven projects will provide me a new set of challenges and I will perform what me and my LCG-UNAM classmates were trained to do: to function as a bridge between multiple fields. I will also keep learning from my JHU colleagues and working with them as I refine my ideas. Currently, this is how I have framed my research interests:\nMy research aims to better understand the roots and signatures of disease (particularly psychiatric disorders) by zooming in across dimensions of gene activity: from studying gene expression at all feature levels (genes to exons to exon-exon junctions and un-annotated regions of expression), to using different gene expression measurement technologies (bulk RNA-seq, single cell/nuclei RNA-seq to spatial transcriptomics) that provide finer biological resolution and localization of gene expression. I’m interested in both hypothesis-driven projects as well as building general resources such as recount2 that enable us to contextualize our findings across all of the public human gene expression landscape. I use the R programming language for nearly all my work and like to organize my code in R packages that I share mostly through the Bioconductor project.\n{width=800px}\nunsplash-logoMarvin Meyer\nAs for building my team, I know that overall one of the challenges everyone faces is recruiting talent. I’ll give this complicated process a shot by tapping into my network which includes many immigrants. I will also expand my network online and through conferences. Furthermore, I am committed to my outreach projects such as CDSB but will synergize them even more: re-use training materials, potentially recruit team members, and help me expand my network. In the meantime, if you are interested in working with me or my colleagues, please let me know!\nFinal decision The decision I had to make was challenging, but in the end, I decided to stay at LIBD because they offered me a path to become a principal investigator in academia which it’s something I want to explore and see where it leads me. I will also formally be someone’s boss and gain managerial experience, work much closer with biologists in hypothesis-driven projects, and overall gain more experience and skills. My brother’s job tasks changed last week, to which I told him: “welcome to the real world”. Well, I guess that’s how it’ll be for me too.\nAcknowledgments I want to thank everyone that helped me through this decision-making process, provided me with information, asked me questions, answered questions, expanded my universe, advocated for me, advised me, cheered for me, and supported me. Thank you! I look forward to working with you!\nvia GIPHY\nThis blog post was made possible thanks to:\nBiocStyle (Oleś, 2023) blogdown (Xie, Hill, and Thomas, 2017) knitcitations (Boettiger, 2021) sessioninfo (Wickham, Chang, Flight, Müller et al., 2021) References [1] C. Boettiger. knitcitations: …","date":1584316800,"expirydate":-62135596800,"kind":"page","lang":"en","lastmod":1689109377,"objectID":"a3a6814db44ca2f2adcc23f8ae9e92fa","permalink":"https://lcolladotor.github.io/2020/03/16/research-scientist-an-academic-career-launch-pad/","publishdate":"2020-03-16T00:00:00Z","relpermalink":"/2020/03/16/research-scientist-an-academic-career-launch-pad/","section":"post","summary":"After a long start to 2020 including the past four very busy weeks, I’m happy to announce that today March 16th 2020 I accepted a position as Research Scientist at the Lieber Institute for Brain Development in Baltimore, MD, USA.","tags":["Academia","Baltimore","Bioconductor","Biostatistics","Diversity","Genomics","immigration","Research","Science","rstats","Teaching","Industry"],"title":"Research Scientist: an academic career launch pad","type":"post"},{"authors":[],"categories":["rstats","Science"],"content":"Yesterday was an extremely exciting day for me and my colleagues. We finished a project we had been working on and shared it with the world. Meaning, it’s done and we can relax for a little bit while we wait for feedback from our peers.\nBut this was not any project, at least not for me. Why do you ask? In general terms, it involved an analysis that you could not search on Google and find the answer for. That is, it involved diving into the unknown!\nvia GIPHY The unknown is scary and as the lyrics say:\nI’ve had my adventure, I don’t need something new I’m afraid of what I’m risking if I follow you Into the unknown\nAll of us have been building our careers with other types of data and/or experiments, and taking on a new type of data knowing we had an early access advantage over others was quite the challenge. I don’t know about my co-authors, but maybe some of them shared thoughts like mine that were along the lines: can I do this? can I make it work? do my analysis choices make sense? what will experts think of doing once they have access to this data? All while racing against time, even if it was just an illusion in our minds.\nBut it’s not my first adventure and I’ve picked up skills and confidence along the way. In particular, I’ve written Bioconductor R packages, dealt with pkgdown/travis issues like #1206, made shiny web applications, analyzed large RNA-seq data, written papers using GoogleDocs, gotten better at asking for help, among other skills.\nIt\u0026#39;s Thurs but here\u0026#39;s the \u0026#34;more\u0026#34; I promised https://t.co/4gahvWDbWE @travisci #pkgdown\n+my fam of #rstats issues today https://t.co/iGFfHLtasM https://t.co/M8DZEHryJZ https://t.co/FU8qq3f5p6\nI\u0026#39;m the pest that visits your GH issues here \u0026amp; there😅Nah, I put lots of 👨🏾💻into them!😊 https://t.co/1G0nd5ZwUJ\n— 🇲🇽 Leonardo Collado-Torres (@lcolladotor) February 28, 2020 I’ve also gotten more comfortable with the idea that I can’t do it all. Others will shortly develop new methods for this type of data, or proper infrastructure to handle this data, or faster visualizations, and so goes on the list. But I’m proud and really happy to say that we built quite the robust prototype. Plus maybe we’ll be involved in shaping this future.\nAnd you noticed that I mentioned we. That’s because I have been learning over the years how to foster collaborations. This particular project involved working with two other members of my workplace who are awesome and that I didn’t know that well. It also involved a new collaboration with someone I’ve known for a while now (we initially met through Twitter in 2014) but hadn’t had the chance to work with. Thus we dove into the unknown together 👩🚀🧑🚀.\nvia GIPHY I feel like we complemented each other quite well and all I can confidently say that our new adventure so far has been very stimulating, even it cost me some sleep.\nWoke up at 3:30 am dreaming about code 👨🏻💻 😴 and on an off till 5:30. Gave up and went to work early... hopefully I can remember the dreams 😅#CodeWhileDreaming #RestFuelsIdeas pic.twitter.com/h0mYHAaL5W\n— 🇲🇽 Leonardo Collado-Torres (@lcolladotor) February 19, 2020 Spatial transcriptomics So, where does spatial transcriptomics come into play and what does it mean? I work with gene activity data which we formally refer to as gene expression 🧬. That is, we measure 🔍🧮 the activity levels of genes for a particular biological condition or tissue sample. For several years now (about since 2007-2009) we have been able to measure many genes from a tissue sample, called bulk RNA-sequencing and abbreviated as RNA-seq.\nThat’s great! But biology is complicated and a single tissue sample is composed of multiple cells of various types. For example, in the brain there are cells that send signals around (neurons) and others that give structure to the brain. That is why technologies for measuring the gene expression at the single cell level were developed, abbreviated as scRNA-seq. scRNA-seq has been used widely to study mouse brains to live tissue samples.\nIn recent years I’ve been working with data from the human brain 🧠. The Lieber Institute for Brain Development has about two thousand brain samples. To preserve them for years to come, the brains are frozen 🥶. Cells are a bit fragile and freezing them breaks them. This fact has made it challenging to study data from frozen human brains. Several of my colleagues work on adapting research protocols to handle frozen human brain tissue. The research field overall has been able to generate single nucleus RNA sequencing (snRNA-seq) data and we are all generating some more.\nsnRNA-seq and scRNA-seq are great because you can measure what genes (pieces of the cell) are active, classify them into groups, and use prior knowledge to label these groups. However, you lose information about what part of the tissue they come from. That’s where technologies for spatial transcriptomics, that is, measuring gene expression 🧬 as close a possible to the single cell level yet retaining spatial coordinates are being …","date":1582934400,"expirydate":-62135596800,"kind":"page","lang":"en","lastmod":1689108805,"objectID":"5112ccd35ebce7df5910ecf98855caeb","permalink":"https://lcolladotor.github.io/2020/02/29/diving-together-into-the-unknown-world-of-spatial-transcriptomics/","publishdate":"2020-02-29T00:00:00Z","relpermalink":"/2020/02/29/diving-together-into-the-unknown-world-of-spatial-transcriptomics/","section":"post","summary":"Yesterday was an extremely exciting day for me and my colleagues. We finished a project we had been working on and shared it with the world. Meaning, it’s done and we can relax for a little bit while we wait for feedback from our peers.","tags":["Networking","Academia","Genomics","rstats","shiny","Statistics"],"title":"Diving together into the unknown world of spatial transcriptomics","type":"post"},{"authors":null,"categories":null,"content":"In February 2020 we published the first pre-print using the 10x Genomics Visium platform for spatial transcriptomics. For this project we created the spatialLIBD Bioconductor package and started developing new analytical methods for this type of data. Given that we shared all the data and code when we posted the pre-print, by the time the peer-reviewed publication was made public in February 2021, others had already used our dataset to develop and showcase their methods. For example, BayesSpace’s pre-print was posted on September 2020, prior to their own June 2021 peer-reviewed publication. We are now using BayesSpace in our projects. This is an example of how open science and open access accelerate science.\n🔥off the press! 👀 our @biorxivpreprint on human 🧠brain @LieberInstitute spatial 🌌🔬transcriptomics data 🧬using Visium @10xGenomics🎉#spatialLIBD\n🔍https://t.co/RTW0VscUKR 👩🏾💻https://t.co/bsg04XKONr\n📚https://t.co/FJDOOzrAJ6\n📦https://t.co/Au5jwADGhYhttps://t.co/PiWEDN9q2N pic.twitter.com/aWy0yLlR50\n— 🇲🇽 Leonardo Collado-Torres (@lcolladotor) February 29, 2020 Our paper describing our package #spatialLIBD is finally out! 🎉🎉🎉\nspatialLIBD is an #rstats / @Bioconductor package to visualize spatial transcriptomics data.\n⁰\nThis is especially exciting for me as it is my first paper as a first author 🦑.https://t.co/COW013x4GA\n1/9 pic.twitter.com/xevIUg3IsA\n— Brenda Pardo (@PardoBree) April 30, 2021 Hot of the pre-print press! 🔥 Our latest work #spatialDLPFC pairs #snRNAseq and #Visium spatial transcriptomic data in the human #DLPFC building a neuroanatomical atlas of this critical brain region 🧠@LieberInstitute @10xGenomics #scitwitter\n📰 https://t.co/NJWJ1mwB9J pic.twitter.com/l8W154XZ50\n— Louise Huuki-Myers (@lahuuki) February 17, 2023 After 10+ years of research, my FIRST 1st-author paper \u0026amp; @biorxivpreprint is finally OUT🥹I delved deep into the human inferior temporal cortex🧠in #Alzheimersdisease, using #VisiumSPG #VectraPolaris #RNAscope \u0026amp; #HALO @Indica_Labs. Check out our📜at https://t.co/QQEy1ZWc1V🔥 pic.twitter.com/dBZNzL1S96\n— Sang Ho (Sangho) Kwon (@sanghokwon17) April 24, 2023 ","date":1582934400,"expirydate":-62135596800,"kind":"page","lang":"en","lastmod":1683608281,"objectID":"0c16f93eb9a58d5be3071464c1967025","permalink":"https://lcolladotor.github.io/project/spatial/","publishdate":"2020-02-29T00:00:00Z","relpermalink":"/project/spatial/","section":"project","summary":"Human brain spatial transcriptomics work using Visium from 10x Genomics","tags":["spatial","HumanPilot","spatialLIBD","VistoSeg","spatialDLPFC","Visium_SPG_AD","scRNAseq","Visium"],"title":"spatial","type":"project"},{"authors":["Sebastian Guelfi __*__","Karishma D’Sa __*__","Juan Botía __*__","Jana Vandrovcova","Regina H. Reynolds","David Zhang","Daniah Trabzuni","Leonardo Collado-Torres","Andrew Thomason","Pedro Quijada Leyton","Sarah A. Gagliano","Mike A. Nalls","International Parkinson’s Disease Genomics Consortium (IPDGC)","UK Brain Expression Consortium","Kerrin S. Small","Colin Smith","Adaikalavan Ramasamy","John Hardy","Michael E. Weale \u0026dagger;","Mina Ryten \u0026dagger;"],"categories":null,"content":" I\u0026#39;m excited to see 👀 this #openaccess work published @NatureComms! Congrats Guelfi @DavidZh03027445 Ryten et al @ucl\nIt used #derfinder to explore the un-annotated 🧬expr + #recount2\u0026#39;s @GTExPortal data to validate the findings\n📜https://t.co/RFqJVLaWFchttps://t.co/nWatlwDQ6G pic.twitter.com/cE8PIrBiAo\n— 🇲🇽 Leonardo Collado-Torres (@lcolladotor) February 25, 2020 ","date":1582588800,"expirydate":-62135596800,"kind":"page","lang":"en","lastmod":1651425968,"objectID":"63dfa8828adaa350b40da14e1d8a7e25","permalink":"https://lcolladotor.github.io/publication/2020-02_basalganglia/","publishdate":"2020-02-25T00:00:00Z","relpermalink":"/publication/2020-02_basalganglia/","section":"publication","summary":"Genome-wide association studies have generated an increasing number of common genetic variants associated with neurological and psychiatric disease risk. An improved understanding of the genetic control of gene expression in human brain is vital considering this is the likely modus operandum for many causal variants. However, human brain sampling complexities limit the explanatory power of brain-related expression quantitative trait loci (eQTL) and allele-specific expression (ASE) signals. We address this, using paired genomic and transcriptomic data from putamen and substantia nigra from 117 human brains, interrogating regulation at different RNA processing stages and uncovering novel transcripts. We identify disease-relevant regulatory loci, find that splicing eQTLs are enriched for regulatory information of neuron-specific genes, that ASEs provide cell-specific regulatory information with evidence for cellular specificity, and that incomplete annotation of the brain transcriptome limits interpretation of risk loci for neuropsychiatric disease. This resource of regulatory data is accessible through our web server, http://braineacv2.inf.um.es/.","tags":["recount2","derfinder"],"title":"Regulatory sites for splicing in human basal ganglia are enriched for disease-relevant information","type":"publication"},{"authors":["Eddie-Luidy Imada __*__","Diego Fernando Sanchez __*__","Leonardo Collado-Torres","Christopher Wilks","Tejasvi Matam","Wikum Dinalankara","Aleksey Stupnikov","Francisco Lobo-Pereira","Chi-Wai Yip","Kayoko Yasuzawa","Naoto Kondo","Masayoshi Itoh","Harukazu Suzuki","Takeya Kasukawa","Chung-Chau Hon","Michiel JL de Hoon","Jay W Shin","Piero Carninci","Andrew E Jaffe","Jeffrey T Leek","Alexander Favorov","Glória R Franco","Benjamin Langmead \u0026dagger;","Luigi Marchionni \u0026dagger;"],"categories":null,"content":" Congrats to Eddie-Luidy @eddieimada Diego @difersanchez \u0026amp; Luigi @marchionniLab et al for our work published in advance at @genomeresearch https://t.co/hIKaqs8XAm 🎉\nIt was powered by #recount2\u0026#39;s BigWig files https://t.co/tK6iRfDhDr \u0026amp; @FANTOM_project\u0026#39;s annotation #RNAseq #rstats pic.twitter.com/MTzZsftpyC\n— 🇲🇽 Leonardo Collado-Torres (@lcolladotor) February 21, 2020 ","date":1582156800,"expirydate":-62135596800,"kind":"page","lang":"en","lastmod":1651425968,"objectID":"7f7e0273b26ba3598b901eff599bc684","permalink":"https://lcolladotor.github.io/publication/2020-02_fantomrecount2/","publishdate":"2020-02-20T00:00:00Z","relpermalink":"/publication/2020-02_fantomrecount2/","section":"publication","summary":"Long noncoding RNAs (lncRNAs) have emerged as key coordinators of biological and cellular processes. Characterizing lncRNA expression across cells and tissues is key to understanding their role in determining phenotypes including human diseases. We present here FC-R2, a comprehensive expression atlas across a broadly defined human transcriptome, inclusive of over 109,000 coding and noncoding genes, as described in the FANTOM CAGE-Associated Transcriptome (FANTOM-CAT) study. This atlas greatly extends the gene annotation used in the original recount2 resource. We demonstrate the utility of the FC-R2 atlas by reproducing key findings from published large studies and by generating new results across normal and diseased human samples. In particular, we (a) identify tissue-specific transcription profiles for distinct classes of coding and noncoding genes, (b) perform differential expression analysis across thirteen cancer types, identifying novel noncoding genes potentially involved in tumor pathogenesis and progression, and (c) confirm the prognostic value for several enhancers lncRNAs expression in cancer. Our resource is instrumental for the systematic molecular characterization of lncRNA by the FANTOM6 Consortium. In conclusion, comprised of over 70,000 samples, the FC-R2 atlas will empower other researchers to investigate functions and biological roles of both known coding genes and novel lncRNAs.","tags":["recount2"],"title":"Recounting the FANTOM CAGE–Associated Transcriptome","type":"publication"},{"authors":["Leonardo Collado-Torres"],"categories":null,"content":" ","date":1581465600,"expirydate":-62135596800,"kind":"page","lang":"en","lastmod":1621020950,"objectID":"1fe1b8d3bcd3617c52b882007319a7e2","permalink":"https://lcolladotor.github.io/talk/libd2020learn/","publishdate":"2020-02-12T00:00:00Z","relpermalink":"/talk/libd2020learn/","section":"talk","summary":"Team building activity based on our work-related search histories","tags":[],"title":"Jaffelab: learn from our search history","type":"talk"},{"authors":[],"categories":["rstats","Ideas"],"content":"Origin of the idea Recently the team I work with has had a few new members and I’ve been thinking lately of ways we could try to help them. The team leader was traveling this week, which gave me the opportunity to come up with a new type of session and test it out. That’s the origin of this learning from our search history idea. We tested it today and I’m quite happy with the results so far, so I thought it would be useful to document what we did and share it with others.\nMotivation The theory As I show in the slides below, in our group we follow the you must try, and then you must ask framework although with a little different interpretation. The basic goal is to search independently for a period of time (say 15 minutes), but then ask others for help if you are still stuck beyond that point.\nIn other words, you have to be able to find some answers yourself since that’s part of our job using resources that range from Google Search, to the Bioconductor Support, to the RStudio Community, among other websites. However, we also acknowledge that some questions have difficult answers. Maybe a Stack Overflow thread has multiple answers and not necessarily the top voted question has the answer you are looking for. So instead of spending too much energy, we also tell our members to avoid getting into a rabbit hole for hours. That’s where asking for help comes to play. And you can ask for help from any community you belong to: those involved in the project through Slack, our full team, other scientists in our university, communities we belong to like the rstats community on Twitter, the Bioconductor users community at large, etc.\nI did mention that it’s ideal to think about the person who will be helping you answer your question. Small reproducible examples, versions of the software you used, sharing your code on GitHub 1, the commands you used and the order you used them in can all be valuable for resolving different types of problems. Jenny Bryan has talked much more about this subject, for example in this 2018 webinar.\nIn practice Trying for a while then asking for help is all good in practice. However, asking for help is very challenging. It’s scary, you open yourself because you show what you don’t know to other people, and sadly historically many questions have been met with negative feedback on the Internet. Thus, they can make you feel dumb, stupid and many other negative emotions.\nI do think that asking for help can be worth it and even wrote a previous blog post on this subject. Some reasons why it’s worth it include being able to move on with your work 2, you might learn something new, and if you follow the strategies for helping others help you, you might even figure out the answer yourself.\nNow, we all ask for help regardless of how long we have been writing code. Here’s an example tweet that conveys the same message. There are thousands of such tweets online.\nI conduct approximately 3948234 programming-related Google searches per day. So does every other developer I know, whether they have 5 weeks of experience or 5 years. Help normalize this practice by tweeting your daily searches with #devgoogle! https://t.co/XfNVUZlhC5\n— Lyzi Diamond (@lyzidiamond) January 15, 2019 We are diverse The team (shown as of May 2018) we work at is very diverse because we all:\nhave different backgrounds, have acquired different skills, are at different career stages (from rotation student up to associate professor), have different interests, use different operating systems (from Fedora to Ubuntu to macOS to Windows) use different tools (mobaxterm vs putty, TextMate vs RStudio, …). But also because we seek help in different ways 3 and we learn differently.\nThis means that we have a lot to learn from each other 😊🤓.\nLearn from each other exercise At bit.ly/learnfromsearch you can find a copy of the Google Spreadsheet with the information you need for your team.\nSome rules First, we need to make sure that everyone will feel save to ask questions. That’s why I:\nreminded others about our code of conduct, invited everyone to practice their empathy and be mindful that language matters 4, to keep everyone’s time in their mind as a question could lead to a longer discussion which is best to take another occasion. 5 Main steps The idea is that you pick a problem you solved recently and share:\nwhat you were trying to solve, the actual text you searched for in Google or elsewhere 6, the link of the website where you find your answer or that guided in this process. We improved the steps as we were testing this! 🙌🏽🙂\nOnce everyone has contributed their information to the spreadsheet, we then proceed to go around the table showing and explaining our search use cases.\nGoals Ultimately the goals of this exercise are to\nempower ourselves with the knowledge from our teammates, learn from how we all find help, build a supportive environment where we feel comfortable asking for help. Thus in the end, we are enabling our team to fully follow the …","date":1581465600,"expirydate":-62135596800,"kind":"page","lang":"en","lastmod":1689109377,"objectID":"f0efd97a85c6155eb33b583bd0b19c5e","permalink":"https://lcolladotor.github.io/2020/02/12/learning-from-our-search-history/","publishdate":"2020-02-12T00:00:00Z","relpermalink":"/2020/02/12/learning-from-our-search-history/","section":"post","summary":"Origin of the idea Recently the team I work with has had a few new members and I’ve been thinking lately of ways we could try to help them. The team leader was traveling this week, which gave me the opportunity to come up with a new type of session and test it out.","tags":["Academia","Teaching","rstats","Diversity","Help"],"title":"Learning from our search history","type":"post"},{"authors":null,"categories":["Conference","rstats"],"content":"In the summer of 2008, nearly 12 years ago, I attended my first R/Bioconductor conference: BioC2008. Just last week I went to my second rstudio::conf(2020) which I greatly enjoyed. After some tweets exchanges today, I started reflecting on my journey and wanted to share my thoughts.\nWhy I like going to conferences I typically enjoy going to conferences, though I also end up exhausted.\nvia GIPHY Part of it could be the traveling and all that goes with it, but I think that conferences are mostly mentally taxing. There’s an information deluge which I typically find overwhelming. Sure, I love finding about new work but at some point it’s like collecting bookmarks of stuff to read or try out later 1. Yet the most exhausting component of going to a conference could be the networking aspect. Meeting others and catching up with friends is extremely rewarding which is why I ultimately sign up for the next conference. How rewarding can it be? My most extreme example is when two professors invited me to apply to the Ph.D. program that I ended up studying. Though simply making friends and having friendly faces around you can go a long way. I’ll expand a bit on this later.\nAs a newbie Across my career I have felt as a newbie when attending many different conferences. I might be alone or maybe have a friend at the conference, or it could be my first time at a conference that I haven’t been to. Your mind, like mine, can be filled up with questions that later might seem simple like:\nHow should I dress? Is it ok to drink alcohol? 2 How do I not feel alone? Am I the odd one here? How can I talk to X or Y person I’ve heard about before but never met? My answers have likely changed over time and currently are:\nComfortable, but remember that this is a work event. So look professional by getting a haircut and dressing up a bit 3. Yes, but not too much and if I don’t want any, that’s ok too. Talk to whoever seems friendly: could be someone new or an old friend or acquaintance. Maybe, but meh 🤷🏽♂️. I do try talking to other latinos or foreigners specially when there’s not many of us around. This one is still hard, but maybe someone I know knows them and can introduce me. If so, I ask for the favor. Otherwise I try to approach them with a question about their work. As a… sponsor? The desire to avoid feeling alone is something that can still shape my behavior at a conference. If possible, I like having some close friends I can hang out with and be relaxed, almost as if we were not at the conference. They provide a zone that I can enter, recharge, and then head out of it again to continue networking.\nYet recently, I’ve grown more conscious of the fact that I’ve been around longer than others. Meaning that I might be the person that knows X or Y that they want to meet or talk to. That is, I find myself more frequently in the position of introducing people and helping them make connections. Somehow asking X or Y: “hey, do you have a minute? Can I introduce you to someone?” is way less scary even if I’m not the closest acquaintance of X or Y. That is, becoming a sponsor: mostly the access portion as defined by this blog post by Emily Robinson.\nSo, while I still network like I used to, a portion of my time is spent checking on others I know so they are not alone and helping them when possible make the connections they want. Doing so also helps me strengthen my own connections as I detailed near the end of my tweet series post-rstudio::conf(2020).\n#rstudioconf + I also asked \u0026amp; appreciated their advise! Thanks!\nI\u0026#39;m just trying to emulate what others have done for me in the past (too many to list, thank youuu!), as I know that getting someone to answer the doorbell is the first step towards opening a door🤗🙌🏾#rstats 11/11\n— 🇲🇽 Leonardo Collado-Torres (@lcolladotor) February 2, 2020 Feeling empowered Reaching out and trying to meet someone is hard and scary. Something that helped me since BioC2008 was the fact that I had others in mind: I knew that I was going to teach R later that fall at LCG-UNAM, so any questions I could get through or people I could meet were huge wins for me. Thus, thinking about others empowered me to network. And that’s still true for me through our CDSB project at comunidadbioinfo.github.io.\nIf I’m still feeling shy or alone, I remember a story from my dad: he claims that without approaching others who were having dinner at a table, introducing himself and creating a social connection, his ideas would have not made the Escherichia coli genome paper that helped launch his career. Personally, once I break that barrier and start to feel comfortable, I feel like I can ask anything: specially feedback and support from others on how to advance some ideas of mine. Lately, that’s mostly been related to our CDSB project.\nI wish others could feel empowered too, yet it’s hard to get there. For now, I simply try to help others emulating what others have done for me. Ultimately, I know that getting someone to answer the doorbell …","date":1580688000,"expirydate":-62135596800,"kind":"page","lang":"en","lastmod":1689109377,"objectID":"704383e3224f0c522e6b072ef43b2caa","permalink":"https://lcolladotor.github.io/2020/02/03/conference-feelings-from-newbie-to-sponsor/","publishdate":"2020-02-03T00:00:00Z","relpermalink":"/2020/02/03/conference-feelings-from-newbie-to-sponsor/","section":"post","summary":"In the summer of 2008, nearly 12 years ago, I attended my first R/Bioconductor conference: BioC2008. Just last week I went to my second rstudio::conf(2020) which I greatly enjoyed. After some tweets exchanges today, I started reflecting on my journey and wanted to share my thoughts.","tags":["Academia","Sponsorship"],"title":"Conference feelings: from newbie to sponsor","type":"post"},{"authors":["Emily E Burke __*__","Joshua G Chenoweth __*__","Joo Heon Shin","Leonardo Collado-Torres","Suel Kee Kim","Nicola Micali","Yanhong Wang","Carlo Colantuoni","Richard E Straub","Daniel J Hoeppner","Huei-Ying Chen","Alana Sellers","Kamel Shibbani","Gregory R Hamersky","Marcelo Diaz Bustamante","BaDoi N Phan","William S Ulrich","Cristian Valencia","Amritha Jaishankar","Amanda J Price","Anandita Rajpurohit","Stephen A Semick","Roland Bürli","James C Barrow","Daniel J Hiler","Stephanie Cerceo Page","Keri Martinowich","Thomas M Hyde","Joel E Kleinman","Karen F Berman","José A Apud","Alan J Cross","Nick J Brandon","Daniel R Weinberger","Brady J Maher","Ronald DG McKay \u0026dagger;","Andrew E Jaffe \u0026dagger;"],"categories":null,"content":" Congrats to the many @LieberInstitute scientists and @AstraZeneca collaborators on our recent #stemcell paper in @NatureComms. Big congrats to Emily Burke and Josh Chenoweth who led this effort! https://t.co/UfMH69rvD5 1/5\n— Andrew Jaffe (@andrewejaffe) January 24, 2020 ","date":1579737600,"expirydate":-62135596800,"kind":"page","lang":"en","lastmod":1651425968,"objectID":"3e735e5a8ca58267130c5af55f762fec","permalink":"https://lcolladotor.github.io/publication/2020-01_libdstemcell/","publishdate":"2020-01-23T00:00:00Z","relpermalink":"/publication/2020-01_libdstemcell/","section":"publication","summary":"Human induced pluripotent stem cells (hiPSCs) are a powerful model of neural differentiation and maturation. We present a hiPSC transcriptomics resource on corticogenesis from 5 iPSC donor and 13 subclonal lines across 9 time points over 5 broad conditions: self-renewal, early neuronal differentiation, neural precursor cells (NPCs), assembled rosettes, and differentiated neuronal cells. We identify widespread changes in the expression of both individual features and global patterns of transcription. We next demonstrate that co-culturing human NPCs with rodent astrocytes results in mutually synergistic maturation, and that cell type-specific expression data can be extracted using only sequencing read alignments without cell sorting. We lastly adapt a previously generated RNA deconvolution approach to single-cell expression data to estimate the relative neuronal maturity of iPSC-derived neuronal cultures and human brain tissue. Using many public datasets, we demonstrate neuronal cultures are maturationally heterogeneous but contain subsets of neurons more mature than previously observed.","tags":["iPSC"],"title":"Dissecting transcriptomic signatures of neuronal differentiation and maturation using iPSCs","type":"publication"},{"authors":["Leonardo Collado-Torres"],"categories":null,"content":" ","date":1571097600,"expirydate":-62135596800,"kind":"page","lang":"en","lastmod":1621020950,"objectID":"0425bf77456be1b7cd26197f209eb0ff","permalink":"https://lcolladotor.github.io/talk/ashg2019/","publishdate":"2019-10-15T00:00:00Z","relpermalink":"/talk/ashg2019/","section":"talk","summary":"Platform talk at ASHG2019","tags":["BrainSeq"],"title":"Regional heterogeneity in gene expression, regulation and coherence in hippocampus and dorsolateral prefrontal cortex across development and in schizophrenia","type":"talk"},{"authors":["Amanda J. Price __*__","[__Leonardo Collado-Torres__](/authors/admin) __*__","Nikolay A. Ivanov","Wei Xia","Emily E. Burke","Joo Heon Shin","Ran Tao","Liang Ma","Yankai Jia","Thomas M. Hyde","Joel E. Kleinman","Daniel R. Weinberger","Andrew E Jaffe \u0026dagger;"],"categories":null,"content":" I\u0026#39;m very excited that this paper is out! https://t.co/sRqnMZyrQY To celebrate, here is a twitter summary complete with relevant gifs! https://t.co/CKedyVIFF1 pic.twitter.com/AYm7Idgvim\n— Amanda Price (@ajprice20) September 27, 2019 Check out 👀 our new paper lead by Amanda Price @ajprice20 where we explored differences in DNA 🧬 methylation between neurons and glia cells. This was my first project with WGBS data with Andrew Jaffe @andrewejaffe Nikolay Ivanov @NikolayA_Ivanov and the rest of the (1/3) #DNAm\n— 🇲🇽 Leonardo Collado-Torres (@lcolladotor) September 27, 2019 ","date":1569456000,"expirydate":-62135596800,"kind":"page","lang":"en","lastmod":1651425968,"objectID":"9ab5f6c18c6f4cd87fe6fa5d71898452","permalink":"https://lcolladotor.github.io/publication/2019-09_dnam_mcph_neuron_glia/","publishdate":"2019-09-26T00:00:00Z","relpermalink":"/publication/2019-09_dnam_mcph_neuron_glia/","section":"publication","summary":"__Background__: DNA methylation (DNAm) is a critical regulator of both development and cellular identity and shows unique patterns in neurons. To better characterize maturational changes in DNAm patterns in these cells, we profile the DNAm landscape at single-base resolution across the first two decades of human neocortical development in NeuN+ neurons using whole-genome bisulfite sequencing and compare them to non-neurons (primarily glia) and prenatal homogenate cortex. __Results__: We show that DNAm changes more dramatically during the first 5 years of postnatal life than during the entire remaining period. We further refine global patterns of increasingly divergent neuronal CpG and CpH methylation (mCpG and mCpH) into six developmental trajectories and find that in contrast to genome-wide patterns, neighboring mCpG and mCpH levels within these regions are highly correlated. We integrate paired RNAseq data and identify putative regulation of hundreds of transcripts and their splicing events exclusively by mCpH levels, independently from mCpG levels, across this period. We finally explore the relationship between DNAm patterns and development of brain-related phenotypes and find enriched heritability for many phenotypes within identified DNAm features. __Conclusions__: By profiling DNAm changes in NeuN-sorted neurons over the span of human cortical development, we identify novel, dynamic regions of DNAm that would be masked in homogenate DNAm data; expand on the relationship between CpG methylation, CpH methylation, and gene expression; and find enrichment particularly for neuropsychiatric diseases in genomic regions with cell type-specific, developmentally dynamic DNAm patterns. __Keywords__: DNA methylation, Neurodevelopment, Gene expression, Non-CpG methylation.","tags":["DNAm"],"title":"Divergent neuronal DNA methylation patterns across human cortical development reveal critical periods and a unique role of CpH methylation","type":"publication"},{"authors":null,"categories":["rstats"],"content":"Are you a Microsoft Windows R user? Does your Windows username include a space? Like Firstname Lastname. Then you might occassionally run into issues installing packages due to spaces.\nSolutions You could either re-install Windows with a username that has no spaces such as Lastname ^[This is the case in the Bioconductor Windows build machine where the username is biocbuild as you can see here.], but that’s probably not an easy option. Or you can:\nEdit your TMP and TEMP environment variables to a location with no spaces, like C:\\TEMP following instructions like these ones. Preferably install R at a location with no spaces, like C:\\R, instead of the default C:\\Program Files ^[In the Bioconductor Windows build machines there are again no spaces in the path to the R installation and the library where packages are installed.]. Backstory A co-worker wanted to install the clusterprofiler Bioconductor package which depends on the DO.db Bioconductor package. This co-worker uses a Windows machine that has a username with a space. Let’s say it was me with Leo Collado to keep them anonymous. The DO.db is only available as a “Source” package with no Windows binary as you can see here.\n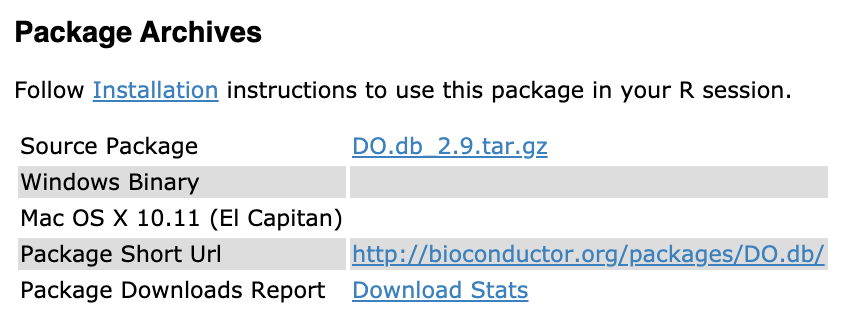{width=600px}\nThis means that R has to:\ndownload a tar.gz file, uncompress it, and then install it. In particular, we are talking about DO.db_2.9.tar.gz in this case.\nThe installation instructions for DO.db are:\nif (!requireNamespace(\u0026#34;BiocManager\u0026#34;, quietly = TRUE)) install.packages(\u0026#34;BiocManager\u0026#34;) BiocManager::install(\u0026#34;DO.db\u0026#34;) Uncompressing Internally, BiocManager::install() ends up using utils::install.packages(). The first step, downloading, works well. Uncompressing a file in this scenario fails. Why?\n\u0026gt; BiocManager::install(\u0026#39;DO.db\u0026#39;, lib = \u0026#39;C:/R/R-3.6.0/library\u0026#39;) Bioconductor version 3.9 (BiocManager 1.30.4), R 3.6.0 (2019-04-26) Installing package(s) \u0026#39;BiocVersion\u0026#39;, \u0026#39;DO.db\u0026#39; ## removed output trying URL \u0026#39;https://bioconductor.org/packages/3.9/data/annotation/src/contrib/DO.db_2.9.tar.gz\u0026#39; Content type \u0026#39;application/x-gzip\u0026#39; length 1769978 bytes (1.7 MB) downloaded 1.7 MB Error in untar2(tarfile, files, list, exdir, restore_times) : incomplete block on file The downloaded source packages are in ‘C:\\Users\\Leo Collado\\AppData\\Local\\Temp\\RtmpqiBJ53\\downloaded_packages’ If you search on Google the error message you’ll find links like this one which hint towards an incomplete download. But the download works. You can even download the file and try to run untar() manually and it will fail.\nWe were told to try installing R at a location with no spaces, so by this point, R was installed at C:\\R\\R-3.6.0\\, hence the lib specification you see above, though it’s irrelevant for these errors.\nUncompressing the tar.gz file is done by utils::untar(). If you look at the code for utils::untar() you’ll see:\n## The function definition of utils::untar function (tarfile, files = NULL, list = FALSE, exdir = \u0026#34;.\u0026#34;, compressed = NA, extras = NULL, verbose = FALSE, restore_times = TRUE, support_old_tars = Sys.getenv(\u0026#34;R_SUPPORT_OLD_TARS\u0026#34;, FALSE), tar = Sys.getenv(\u0026#34;TAR\u0026#34;)) ## Inside utils::untar() if (inherits(tarfile, \u0026#34;connection\u0026#34;) || identical(tar, \u0026#34;internal\u0026#34;)) { if (!missing(compressed)) warning(\u0026#34;argument \u0026#39;compressed\u0026#39; is ignored for the internal method\u0026#34;) return(untar2(tarfile, files, list, exdir, restore_times)) } ## Further below TAR \u0026lt;- tar if (!nzchar(TAR) \u0026amp;\u0026amp; .Platform$OS.type == \u0026#34;windows\u0026#34; \u0026amp;\u0026amp; nzchar(Sys.which(\u0026#34;tar.exe\u0026#34;))) TAR \u0026lt;- \u0026#34;tar.exe\u0026#34; if (!nzchar(TAR) || TAR == \u0026#34;internal\u0026#34;) return(untar2(tarfile, files, list, exdir)) In this case, the first untar2() call is called. That is: return(untar2(tarfile, files, list, exdir, restore_times)). The error message incomplete block on file is not really informative in this case because untar2() is not happy when there’s a space in the path to the file ^[Hopefully in the future Google will lead you to this blog post and you might avoid the rabbit hole I went through!].\nWe can get around this untar2() issue by uncompressing the tar.gz file ourselves in a path that has no spaces. For example, if we download DO.db_2.9.tar.gz to C:\\R we can uncompress the tar.gz file with:\nutils::untar(\u0026#39;C:/R/DO.db_2.9.tar.gz\u0026#39;) Installation Let’s proceed to installing the package.\n\u0026gt; install.packages(\u0026#39;C:/R/DO.db\u0026#39;, repos = NULL, type = \u0026#39;source\u0026#39;, lib = \u0026#39;C:/R/R-3.6.0/library\u0026#39;) * installing *source* package \u0026#39;DO.db\u0026#39; ... ** using staged installation ** R ** inst ** byte-compile and prepare package for lazy loading ARGUMENT \u0026#39;Collado\\AppData\\Local\\Temp\\Rtmp8EQDjB\\Rin2ef05088650f\u0026#39; __ignored__ Error: object \u0026#39;ÿþ\u0026#39; not found Execution halted ERROR: lazy loading failed for package \u0026#39;DO.db\u0026#39; * removing \u0026#39;C:/R/R-3.6.0/library/DO.db\u0026#39; Warning message: In install.packages(\u0026#34;C:/R/DO.db\u0026#34;, repos = NULL, type = \u0026#34;source\u0026#34;, : installation of package ‘C:/R/DO.db’ had non-zero exit status \u0026gt; Oh noes! It didn’t work 😖 What happened?\nIf you …","date":1568764800,"expirydate":-62135596800,"kind":"page","lang":"en","lastmod":1689109377,"objectID":"e1fe4ab08e978b45679a896ac22926f5","permalink":"https://lcolladotor.github.io/2019/09/18/windows-user-space-issues-with-installing-r-packages/","publishdate":"2019-09-18T00:00:00Z","relpermalink":"/2019/09/18/windows-user-space-issues-with-installing-r-packages/","section":"post","summary":"Are you a Microsoft Windows R user? Does your Windows username include a space? Like Firstname Lastname. Then you might occassionally run into issues installing packages due to spaces.\nSolutions You could either re-install Windows with a username that has no spaces such as Lastname ^[This is the case in the Bioconductor Windows build machine where the username is biocbuild as you can see here.","tags":["Windows","rstats","tutorial","Bioconductor"],"title":"Windows user space issues with installing R packages","type":"post"},{"authors":["Leonardo Collado-Torres"],"categories":null,"content":" ","date":1564963200,"expirydate":-62135596800,"kind":"page","lang":"en","lastmod":1621020950,"objectID":"c60e6fb07eeadff98c32d06bc36832a3","permalink":"https://lcolladotor.github.io/talk/liigh2019/","publishdate":"2019-08-05T00:00:00Z","relpermalink":"/talk/liigh2019/","section":"talk","summary":"Visitor seminar at LIIGH-UNAM","tags":["recount brain","BrainSeq"],"title":"Analyzing BrainSeq Phase II and generating the recount-brain resource","type":"talk"},{"authors":["Leonardo Collado-Torres"],"categories":null,"content":" ","date":1564358400,"expirydate":-62135596800,"kind":"page","lang":"en","lastmod":1621020950,"objectID":"de32d1a15efdb45b83ce6cbcd5b2e714","permalink":"https://lcolladotor.github.io/talk/cdsb2019/","publishdate":"2019-07-29T00:00:00Z","relpermalink":"/talk/cdsb2019/","section":"talk","summary":"Inaugural talk for kickstarting the CDSB2019 workshop.","tags":["CDSB"],"title":"Launch of CDSB2019","type":"talk"},{"authors":["Leonardo Collado-Torres"],"categories":null,"content":" ","date":1561507200,"expirydate":-62135596800,"kind":"page","lang":"en","lastmod":1621020950,"objectID":"c83f56636a9f5f27ee764265aeb58ddd","permalink":"https://lcolladotor.github.io/talk/bioc2019/","publishdate":"2019-06-26T00:00:00Z","relpermalink":"/talk/bioc2019/","section":"talk","summary":"recount workshop for BioC2019","tags":["recount2"],"title":"BioC2019 recount workshop","type":"talk"},{"authors":["Leonardo Collado-Torres"],"categories":null,"content":" ","date":1561334400,"expirydate":-62135596800,"kind":"page","lang":"en","lastmod":1621020950,"objectID":"9ea7d30a98f0a582e611e303e57d3324","permalink":"https://lcolladotor.github.io/talk/bioc2019cdsb/","publishdate":"2019-06-24T00:00:00Z","relpermalink":"/talk/bioc2019cdsb/","section":"talk","summary":"Lightning talk on CDSB updates for BioC2019","tags":["CDSB"],"title":"BioC2019: CDSB updates","type":"talk"},{"authors":["Carrie Wright __*__","Anandita Rajpurohit __*__","Emily E. Burke"," Courtney Williams","Leonardo Collado-Torres","Martha Kimos","Nicholas J. Brandon","Alan J. Cross","Andrew E. Jaffe","Daniel R. Weinberger \u0026dagger;","Joo Heon Shin \u0026dagger;"],"categories":null,"content":" Interested in #smallRNA? Check out @LieberInstitute\u0026#39;s new publication @BMC_series #BMCGenomics! 🎉 We found major differences in commonly used #rnaSeq #miRNAseq methods for #miRNA and #isomiR quantifications. https://t.co/rGTuCAnsOO pic.twitter.com/L9IEnMvGTJ\n— mirnas22 (@mirnas22) July 2, 2019 ","date":1561075200,"expirydate":-62135596800,"kind":"page","lang":"en","lastmod":1651425968,"objectID":"9db5d0473d020d72bb48cc5ad2322226","permalink":"https://lcolladotor.github.io/publication/2019-06_mirna_kit_comp/","publishdate":"2019-06-21T00:00:00Z","relpermalink":"/publication/2019-06_mirna_kit_comp/","section":"publication","summary":"Background: RNA sequencing offers advantages over other quantification methods for microRNA (miRNA), yet numerous biases make reliable quantification challenging. Previous evaluations of these biases have focused on adapter ligation bias with limited evaluation of reverse transcription bias or amplification bias. Furthermore, evaluations of the quantification of isomiRs (miRNA isoforms) or the influence of starting amount on performance have been very limited. No study had yet evaluated the quantification of isomiRs of altered length or compared the consistency of results derived from multiple moderate starting inputs. We therefore evaluated quantifications of miRNA and isomiRs using four library preparation kits, with various starting amounts, as well as quantifications following removal of duplicate reads using unique molecular identifiers (UMIs) to mitigate reverse transcription and amplification biases. Results: All methods resulted in false isomiR detection; however, the adapter-free method tested was especially prone to false isomiR detection. We demonstrate that using UMIs improves accuracy and we provide a guide for input amounts to improve consistency. Conclusions: Our data show differences and limitations of current methods, thus raising concerns about the validity of quantification of miRNA and isomiRs across studies. We advocate for the use of UMIs to improve accuracy and reliability of miRNA quantifications.","tags":["miRNA"],"title":"Comprehensive assessment of multiple biases in small RNA sequencing reveals significant differences in the performance of widely used methods","type":"publication"},{"authors":["Leonardo Collado-Torres","Emily E Burke","Amy Peterson","JooHeon Shin","Richard E Straub","Anandita Rajpurohit","Stephen A Semick","William S Ulrich","BrainSeq Consortium","Amanda J Price","Cristian Valencia","Ran Tao","Amy Deep-Soboslay","Thomas M Hyde","Joel E Kleinman","Daniel R Weinberger \u0026dagger;","Andrew E Jaffe \u0026dagger;"],"categories":null,"content":" I\u0026#39;m thrilled to announce @LieberInstitute\u0026#39;s BrainSeq Phase II paper publication today https://t.co/XHjp6CryoG 🎉@NeuroCellPress\nWork by @andrewejaffe @Dr_Weinberger @amptrsn @SteveSemick @CristianValPe01 @ajprice20 et al from the past yrs@biorxivpreprint https://t.co/ptjNrpSgyh pic.twitter.com/An726JOyzD\n— 🇲🇽 Leonardo Collado-Torres (@lcolladotor) June 4, 2019 ","date":1559606400,"expirydate":-62135596800,"kind":"page","lang":"en","lastmod":1651425968,"objectID":"94c76dd6c326a03083d9d5630ce4097b","permalink":"https://lcolladotor.github.io/publication/2019-06_bsp2/","publishdate":"2019-06-04T00:00:00Z","relpermalink":"/publication/2019-06_bsp2/","section":"publication","summary":"The hippocampus formation, although prominently implicated in schizophrenia pathogenesis, has been overlooked in large-scale genomics efforts in the schizophrenic brain. We performed RNA-seq in hippocampi and dorsolateral prefrontal cortices (DLPFCs) from 551 individuals (286 with schizophrenia). We identified substantial regional differences in gene expression and found widespread developmental differences that were independent of cellular composition. We identified 48 and 245 differentially expressed genes (DEGs) associated with schizophrenia within the hippocampus and DLPFC, with little overlap between the brain regions. 124 of 163 (76.6%) of schizophrenia GWAS risk loci contained eQTLs in any region. Transcriptome-wide association studies in each region identified many novel schizophrenia risk features that were brain region-specific. Last, we identified potential molecular correlates of in vivo evidence of altered prefrontal-hippocampal functional coherence in schizophrenia. These results underscore the complexity and regional heterogeneity of the transcriptional correlates of schizophrenia and offer new insights into potentially causative biology.","tags":["BrainSeq"],"title":"Regional heterogeneity in gene expression, regulation, and coherence in the frontal cortex and hippocampus across development and schizophrenia","type":"publication"},{"authors":["Leonardo Collado-Torres"],"categories":null,"content":" ","date":1557324000,"expirydate":-62135596800,"kind":"page","lang":"en","lastmod":1683613619,"objectID":"e6175581616c9fd3cb7e9dc179a3fdca","permalink":"https://lcolladotor.github.io/publication/poster2019bog/","publishdate":"2019-05-08T14:00:00Z","relpermalink":"/publication/poster2019bog/","section":"publication","summary":"Poster presented at BoG2019","tags":["recount2","recount brain","Poster"],"title":"recount-brain: a curated repository of human brain RNA-seq datasets metadata","type":"publication"},{"authors":["Ashkaun Razmara","Ellis SE","Sokolowski DJ","Davis S","Wilson MD","Leek JT","Jaffe AE","[__L Collado-Torres__](/authors/admin) \u0026dagger;"],"categories":null,"content":" Our new @biorxivpreprint lead by @ashkaun_razmara is now out 🙌🏾\nrecount-brain has curated 🧠 metadata which you can integrate with #RNAseq expression data from #recount2\n📜 https://t.co/WevoDNpziw\nCode: https://t.co/vm8MPBg8Qy\nThx team! ✌🏾😊@LieberInstitute #reproducibility pic.twitter.com/CDlflNgCFA\n— 🇲🇽 Leonardo Collado-Torres (@lcolladotor) April 25, 2019 ","date":1556142343,"expirydate":-62135596800,"kind":"page","lang":"en","lastmod":1651425968,"objectID":"185fe1d7bbc72e856b905b97a0e26e49","permalink":"https://lcolladotor.github.io/publication/preprint_recount_brain/","publishdate":"2019-04-24T16:45:43-05:00","relpermalink":"/publication/preprint_recount_brain/","section":"publication","summary":"The usability of publicly-available gene expression data is often limited by the availability of high-quality, standardized biological phenotype and experimental condition information (“metadata”). We released the recount2 project, which involved re-processing ∼70,000 samples in the Sequencing Read Archive (SRA), Genotype-Tissue Expression (GTEx), and The Cancer Genome Atlas (TCGA) projects. While samples from the latter two projects are well-characterized with extensive metadata, the ∼50,000 RNA-seq samples from SRA in recount2 are inconsistently annotated with metadata. Tissue type, sex, and library type can be estimated from the RNA sequencing (RNA-seq) data itself. However, more detailed and harder to predict metadata, like age and diagnosis, must ideally be provided by labs that deposit the data. To facilitate more analyses within human brain tissue data, we have complemented phenotype predictions by manually constructing a uniformly-curated database of public RNA-seq samples present in SRA and recount2. We describe the reproducible curation process for constructing recount-brain that involves systematic review of the primary manuscript, which can serve as a guide to annotate other studies and tissues. We further expanded recount-brain by merging it with GTEx and TCGA brain samples as well as linking to controlled vocabulary terms for tissue, Brodmann area and disease. Furthermore, we illustrate how to integrate the sample metadata in recount-brain with the gene expression data in recount2 to perform differential expression analysis. We then provide three analysis examples involving modeling postmortem interval, glioblastoma, and meta-analyses across GTEx and TCGA. Overall, recount-brain facilitates expression analyses and improves their reproducibility as individual researchers do not have to manually curate the sample metadata. recount-brain is available via the add_metadata() function from the recount Bioconductor package at bioconductor.org/packages/recount.","tags":["recount2","recount brain"],"title":"recount-brain: a curated repository of human brain RNA-seq datasets metadata","type":"publication"},{"authors":["Anil K Madugundu","Chan Hyun Na","Raja Sekhar Nirujogi","Santosh Renuse","Kwang Pyo Kim","Kathleen H. Burns","Christopher Wilks","Ben Langmead","Shannon E. Ellis","Leonardo Collado-Torres","Marc K. Halushka","Min-Sik Kim","Akhilesh Pandey \u0026dagger;"],"categories":null,"content":" I\u0026#39;m glad to see published this project lead by Anil Madugundu in Akhilesh Pandey\u0026#39;s labhttps://t.co/MF3PGL18et @proteomics\nIt was our first #recount2 collab w/ @Shannon_E_Ellis @chrisnwilks @BenLangmead where we brainstormed how to use the exon-exon junction data for proteomics pic.twitter.com/TI5PWq19Ok\n— 🇲🇽 Leonardo Collado-Torres (@lcolladotor) August 14, 2019 ","date":1555200000,"expirydate":-62135596800,"kind":"page","lang":"en","lastmod":1651425968,"objectID":"1de5b29289eb03df88d7e06d499c1d73","permalink":"https://lcolladotor.github.io/publication/2019-04_recount_proteomics/","publishdate":"2019-04-14T00:00:00Z","relpermalink":"/publication/2019-04_recount_proteomics/","section":"publication","summary":"Understanding the molecular profile of every human cell type is essential for understanding its role in normal physi-ology and disease. Technological advancements in DNA sequencing, mass spectrometry, and computational methodsallow us to carry out multiomics analyses although such approaches are not routine yet. Human umbilical vein endothe-lial cells (HUVECs) are a widely used model system to study pathological and physiological processes associated withthe cardiovascular system. In this study, next-generation sequencing and high-resolution mass spectrometry to profilethe transcriptome and proteome of primary HUVECs is employed. Analysis of 145 million paired-end reads from next-generation sequencing confirmed expression of 12 186 protein-coding genes (FPKM \u003e= 0.1), 439 novel long non-codingRNAs, and revealed 6089 novel isoforms that were not annotated in GENCODE. Proteomics analysis identifies 6477proteins including confirmation ofN-termini for 1091 proteins, isoforms for 149 proteins, and 1034 phosphosites. Adatabase search to specifically identify other post-translational modifications provide evidence for a number of modifi-cation sites on 117 proteins which include ubiquitylation, lysine acetylation, and mono-, di- and tri-methylation events.Evidence for 11 'missing proteins', which are proteins for which there was insufficient or no protein level evidence, isprovided. Peptides supporting missing protein and novel events are validated by comparison of MS/MS fragmentationpatterns with synthetic peptides. Finally, 245 variant peptides derived from 207 expressed proteins in addition to alternatetranslational start sites for seven proteins and evidence for novel proteoforms for five proteins resulting from alternativesplicing are identified. Overall, it is believed that the integrated approach employed in this study is widely applicable tostudy any primary cell type for deeper molecular characterization.","tags":["recount2"],"title":"Integrated Transcriptomic and Proteomic Analysis of Primary Human Umbilical Vein Endothelial Cells","type":"publication"},{"authors":null,"categories":["Web","rstats"],"content":"The hugo-academic theme which powers my website is active and frequently updated. I don’t update my website that frequently anymore, but I recently found about many of their changes when I made the CDSB website.\nWe are delighted to share with you our new webpage at https://t.co/rNuiRlNixV with both English and Spanish support\nEstamos encantados de compartirles nuestra nueva página web que viene en español e inglés\nIt\u0026#39;ll replace/remplazará a https://t.co/SMtJbOM9KO#rstatsES #diversity pic.twitter.com/1SVg9rcqVf\n— ComunidadBioInfo (@CDSBMexico) April 5, 2019 One of the new features that I liked quite a bit was the ability to have landing pages for each person in your team. I wanted to improve my website’s section describing the people I’ve mentored so I decided to update my personal website too. Once I started this process, I realized that talks and publications had drastically changed. You could now have an image per talk or publication, add tags to them and link them to projects. Furthermore, I noticed that I hadn’t uploaded all my posters nor the slides for all my talks. So this whole process of updating my website took quite a bit of time! All this new information is also reflected on my CV now.\nThe end result: alumni First of all, I really like how the section describing the people I’ve mentored looks now. You can see the faces of the alumni and navigate to a page describing them in more detail.\nFor example, check Amy Peterson’s landing page which includes links to all her profiles I know about. I was also able to add some pictures of a key event with her: her MPH capstone final presentation.\nMy academic career In this new version of my website you can also quickly take a look at my academic career by browsing through my talks and publications (papers, posters and a book chapter). The papers are fancier, but the posters and the talks tell you a more detailed story of how I’ve advanced through my career so far with in progress talks and posters showing some ideas, many of which we discareded in the end. For example, you can look at the poster I presented at BioC2010 which is when I met Rafa and Ingo from JHU Biostat. Through the posters and talks you can see how the derfinder project came to be and culminated in the publication describing the software, which was my main Ph.D. project. I like how all the talks and posters related to derfinder can easily be found through the project page. The talks now include my Ph.D. defense talk 🙌🏽✌🏽.\nYou can also see how the templates I used for making talks evolved through time starting with my joint undergrad project with Sur Herrera-Paredes. You can find some presentaitons made with Beamer, others with knitr (before rmarkdown existed), some with RStudio presentations, as well as different PowerPoint templates.\nOverall, I’m very happy with my new website and I hope that you enjoy browsing through my academic career. I’ll use it to movitate others by showing them that we all start somewhere and it takes time and effort to grow.\nSome code for udpating to hugo academic 4.1.0 If you are updating your hugo-academic website you should be prepared to spend a significant amount of time if you want to include all the details I included. It took me most of my Saturday, Monday afternoon, and several hours on Tuesday to update mine. Here’s some code I used in this process that might be helpful to you.\n## I copied my lcolladotorsource/content/talk files to ~/Downloads/ugh-talks ## then I made a new directory named after the initial .md files ## I made this process easier when updating my publications ## (see further below) p_ori \u0026lt;- \u0026#39;~/Downloads/ugh-talks/\u0026#39; p_new \u0026lt;- \u0026#39;/users/lcollado/Dropbox/code/lcolladotorsource/content/talk\u0026#39; f \u0026lt;- dir(p_ori) ff \u0026lt;- gsub(\u0026#39;.md\u0026#39;, \u0026#39;\u0026#39;, f) ## For testing # i \u0026lt;- 1 for(i in seq_len(length(f))) { f_initial \u0026lt;- file.path(p_ori, f[i]) f_new \u0026lt;- file.path(p_new, ff[i], \u0026#39;index.md\u0026#39;) initial \u0026lt;- readLines(f_initial) new \u0026lt;- readLines(f_new) ## For a set of tags present in the previous version of hugo-academic ## I was using and the latest one, I found the initial strings ## such that I could find and replace the text. ## I also made sure to delete that info on the previous version ## so I could inspect rapidly if there was any information ## on the old version that I hadn\u0026#39;t transfered to the new version. ## This typically involved some custom urls whose syntax is now ## different. for(j in c(\u0026#39;location\u0026#39;, \u0026#39;abstract \u0026#39;, \u0026#39;event_url\u0026#39;, \u0026#39;url_video\u0026#39;, \u0026#39;url_slides\u0026#39;, \u0026#39;title\u0026#39;, \u0026#39;url_pdf\u0026#39;, \u0026#39;event \u0026#39;, \u0026#39;math\u0026#39;)) { ## for debugging: # print(j) patt \u0026lt;- paste0(\u0026#39;^\u0026#39;, j) cont \u0026lt;- initial[grep(patt, initial)] initial[grep(patt, initial)] \u0026lt;- \u0026#39;\u0026#39; stopifnot(length(grep(patt, new)) \u0026gt; 0) # print(length(cont)) new[grep(patt, new)] \u0026lt;- cont } ## For times I had to do this manually ## since the names for these tags changed j \u0026lt;- \u0026#39;time_start\u0026#39; patt \u0026lt;- paste0(\u0026#39;^\u0026#39;, j) cont \u0026lt;- initial[grep(patt, initial)] initial[grep(patt, initial)] \u0026lt;- \u0026#39;\u0026#39; new[grep(\u0026#39;^date \u0026#39;, new)] \u0026lt;- gsub(\u0026#39;time_start\u0026#39;, \u0026#39;date\u0026#39;, cont) ## and …","date":1554854400,"expirydate":-62135596800,"kind":"page","lang":"en","lastmod":1689109377,"objectID":"2a830d27300cf268a51e0d694921e958","permalink":"https://lcolladotor.github.io/2019/04/10/the-evolution-of-my-academic-career-as-seen-through-posters-and-talks-thanks-to-hugo-academic-4-1/","publishdate":"2019-04-10T00:00:00Z","relpermalink":"/2019/04/10/the-evolution-of-my-academic-career-as-seen-through-posters-and-talks-thanks-to-hugo-academic-4-1/","section":"post","summary":"The hugo-academic theme which powers my website is active and frequently updated. I don’t update my website that frequently anymore, but I recently found about many of their changes when I made the CDSB website.","tags":["Academia","Website"],"title":"The evolution of my academic career as seen through posters and talks thanks to hugo academic 4.1","type":"post"},{"authors":null,"categories":["Science"],"content":"These past months I’ve been mostly working on one huge project which might be close to an end, hopefully! This project involves a massive manuscript with many supplementary figures and tables. Today we sent it out to other members in our team, and to celebrate, I’m now writing more 😅: though this is a blog post. I’m allowing myself to do so before I dive into the pile of tasks I haven’t completed1. So I’m going to share with you the tools I’ve been using since 2018 or so for writing academic documents shared via Google Docs. You can use these tools for manuscripts2, capstone projects3, and well, basically any document where you want to do any of the following:\nAutomatic figure/table numbering Insert math equations Cite the literature Yes, you can do both with LaTeX and you can collaborate with others using Overleaf, but it’s really hard to convince others to use LaTeX in my experience.\nCitations There are many tools out there for you to organize the literature items you are reading or keeping tabs on. Some of them are Zotero and Mendeley, which you might have heard about. The one that I highly recommend for writing documents with Google Docs is F1000Workspace.\nGet an account First, you need to make an account. Worried about paying? Don’t worry, the accounts are free4!\nI strongly recommend that you use your academic email here if you have one, because I believe that it grants you access for an unlimited free account. Your university might also give you free access.\nStart a project Once you have your account set up, start a shared project. I mean, private ones also work, but shared ones allow you to collaborate with others so that your teammembers can also update the citations in your document. For example, we have one called brainseq phase2.\nOnce you open your project page, at the top left you’ll see a big blue button called Import References. Click on it.\nAs you can see, F1000Workspace allows you to import references from many different sources. I typically import using identifiers, either a DOI or a PMID one. They also have a browser add-on that you can use to import references into your library when using websites such as PubMed.\nInsert references into a Google Doc On your Google Chrome browser, install the F1000Workspace Google Docs add-on available here. Next, open up your Google Doc and you’ll see that F1000 appears in your toolbar. If you click on it, the F1000 interface will open on the right sidebar.\nThat interface lets you link your Google Doc to a particular F1000Workspace project, which I recommend doing. You can then go to Insert citations and start searching your project citations. I typically search by name or by the identifier, which is particularly useful if I just added the reference to the project via the identifier on a separate browser tab.\nUpdate your document’s bibliography Lets say that you’ve added a few citations in your document and now want to format them appropriately. In your Google Doc, click on F1000, then navigate to the Format citations and bibliography section.\nBefore you click the big blue button that says Update citations and bibliography you’ll notice a dropdown menu that lets you choose your favorite citation style (or whichever the journal you want to send your manuscript requires).\nThe end!\nNotes Well, not really. You’ll likely keep adding many citations as you keep working on your document. One thing that I’ve noticed is that the F1000Workspace add-on has a bit of trouble under “suggesting” mode or when the citation was inserted as a suggestion. So I recommend that you accept the suggestion first, then use “editing” mode for updating your bibliography file. It’s always good to keep an eye on what the add-on is doing so you can notice anything weird and undo it with ctrl + z (cmd + z in macOS).\nAnd hey, did you know that F1000Workspace also works with Microsoft Word?\nFor more details, check the FAQs.\nAutomatic figure numbering Now that we have figured out citations in Google Docs, lets learn how to cross reference figures, tables, equations, and whatever else you want. This is something that LaTeX users are familiar with but that you can’t do out of the box in Google Docs or Microsoft Word (as far as I know). Luckily others have made add-ons that solve this problem. The one I use, and so do other 11,197 people as of today, is Cross Reference available from the Google Chrome Store for free.\nThis add-on allows the user to label equations, figures and tables and refer to them within the text. It now also allows users to create labels for any element. These elements are numbered automatically and references are updated to match. If their order changes, references update to match. If one is removed, references to it are highlighted in red in the text. The text and style of references and labels can be customised.\nInsert labels and references as hyperlinks. Instead of a URL, add a code recognised by Cross Reference, then an underscore, then your choice of name. …","date":1554163200,"expirydate":-62135596800,"kind":"page","lang":"en","lastmod":1689109377,"objectID":"6de6a5c28407bb9486dd61555df5464b","permalink":"https://lcolladotor.github.io/2019/04/02/how-to-write-academic-documents-with-googledocs/","publishdate":"2019-04-02T00:00:00Z","relpermalink":"/2019/04/02/how-to-write-academic-documents-with-googledocs/","section":"post","summary":"These past months I’ve been mostly working on one huge project which might be close to an end, hopefully! This project involves a massive manuscript with many supplementary figures and tables.","tags":["Google","Academia","LaTeX","tutorial"],"title":"How to write academic documents with GoogleDocs","type":"post"},{"authors":null,"categories":["rstats","Conference","UNAM"],"content":"This blog post was first published at the CDSBMexico website.\n#CDSBMexico: remember to apply for BioC2019 travel scholarships!!\nDue date is March 15thhttps://t.co/iegG0qQzwu\nLet us help you! Here we give you some ideas 💡We can also give you feedback via Slack ✅#rstats #bioconductor @Bioconductor #bioc2019 #diversity #LatAm #rstatsES pic.twitter.com/EORg8d2Qxj\n— ComunidadBioInfo (@CDSBMexico) March 1, 2019 About 10 months ago we announced our plans to start a new community of R/Bioconductor developers in Mexico and Latin America. The National Bioinformatics Node (NNB-UNAM in Spanish) has organized workshops in bioinformatics and R since 2006 and more frequently since 2010. Last year, 2018, there were five simultaneous one week workshops:\nIntroduction to R and RStudio Exploratory data analysis (EDA) of biological data with R EDA of RNA-seq data and differential expression studies Genome assembly and annotation from high-throughput sequencing data And our Latin American R/Bioconductor Developers Workshop Overall it was a success as described in A recap of CDSB 2018: the start of a community. However, we are not done yet! 💪🏽As we have stated several times, our goal is to turn R users into developers and to increase the representation of Mexicans and Latin Americans at other R events.\nBioC2019 The one R event that we followed as a guide last year is the Bioconductor yearly meeting, or BioC. This year, BioC2019 will be held during June 24 to 27 at New York City in the United States. If you are an academic the registration fee is 300 USD prior to May 24th. As of today (Feb 28th), a round trip from Mexico City on June 23 to 28th is about 320-410 USD1. The accommodation options listed start at 118 USD plus tax a night. As you can see, these numbers add up fairly fast which is a limiting factor for scientists from Mexico (and Latin American in general) to attend BioC2019.\nTravel scholarships However, we want to remind you that there are travel scholarships available! And we, CDSB, want to help you! 🙌🏽\nAll the details about the travel scholarship and different types of submission proposals are available on the BioC2019 website. But let us summarize the process for you.\nYou have to apply for either a talk, poster or workshop. You need a professional website, GitHub profile or your CV to be available online. You need to answer two questions: How have you participated in the Bioconductor project in the past? What do you hope to get out of the conference? For a talk or poster proposal you have a maximum of 300 words while workshop proposals involve filling out a template.\nThis is quite a bit of work, but the payoff is immense! You will compete for the opportunity to travel basically for free: free registration and hotel, plus $500 for travel expenses. This can be a career changing opportunity as it was the case for L. Collado-Torres (see his keynote slides) and others.\nGet started on your scholarship application! We know that many of us have a tendency to do things at the last minute. However, we hope 🙏🏽 that you start your application materials as soon as you can. Remember that the deadline is March 15th and no exceptions are made.\nWebsite If you don’t have a professional website, we recommend that you make one following Emily Zabor’s tutorial. This is the tutorial that one of your fellow CDSBMexico 2018 attendees used to create his website: joseaia.github.io. Alternatively, check out the Chromebook Data Science: intro to R course (available for free if you can’t afford it) which includes a lesson that walks you through this process.\nBioconductor project participation Next, we know that each of you worked at least in one R package during CDSBMexico 2018 such as rGriffin (check the blog post). Maybe you even submitted your package to Bioconductor. At least, you met and interacted with longtime Bioconductor members such as Martin Morgan and Benilton Carvalho. Since then, you might have worked on other R packages, shiny applications, etc. You might have also answered questions on the Bioconductor support website, reported bugs or opened issues in existing packages, joined the developers mailing list, joined the Bioconductor Slack workspace, etc. Ultimately, you could potentially present a poster or give a talk about the package you worked on last summer, but you’ll need to coordinate with your team members and/or lab principal investigator.\nBenefitting from BioC2019 As for what you hope to get out of the conference, well, we will remind you that BioC has different workshops that can help you advance your R skills and knowledge. Furthermore, there’ll be scientific talks from excellent bioinformatics researchers. Then, once you return from the conference, you can spread the knowledge you acquired in a variety of ways: implementing it on your work, teaching at your local university or research institute, participating in the Bioconductor community (Slack, the support website, contributing an R package, etc), presenting at a …","date":1551312000,"expirydate":-62135596800,"kind":"page","lang":"en","lastmod":1689109377,"objectID":"5dbe586595ed3b05a8356cd15429f170","permalink":"https://lcolladotor.github.io/2019/02/28/cdsbmexico-remember-to-apply-for-bioc2019-travel-scholarships/","publishdate":"2019-02-28T00:00:00Z","relpermalink":"/2019/02/28/cdsbmexico-remember-to-apply-for-bioc2019-travel-scholarships/","section":"post","summary":"This blog post was first published at the CDSBMexico website.\n#CDSBMexico: remember to apply for BioC2019 travel scholarships!!\nDue date is March 15thhttps://t.co/iegG0qQzwu\nLet us help you! Here we give you some ideas 💡We can also give you feedback via Slack ✅#rstats #bioconductor @Bioconductor #bioc2019 #diversity #LatAm #rstatsES pic.","tags":["Diversity","Bioconductor"],"title":"CDSBMexico: remember to apply for BioC2019 travel scholarships","type":"post"},{"authors":["Leonardo Collado-Torres"],"categories":null,"content":" ","date":1551099600,"expirydate":-62135596800,"kind":"page","lang":"en","lastmod":1621020950,"objectID":"b05b7dd4cc4157571965473bfdcb17d5","permalink":"https://lcolladotor.github.io/talk/libd2019/","publishdate":"2019-02-25T13:00:00Z","relpermalink":"/talk/libd2019/","section":"talk","summary":"Update on BrainSeq Phase II and recount-brain for the LIBD 2019 staff seminar series","tags":["recount brain","BrainSeq"],"title":"Analyzing BrainSeq Phase II and generating the recount-brain resource","type":"talk"},{"authors":null,"categories":["Misc"],"content":"In the past months I’ve had a recurrent conversation with many people. This conversation is typically started with the question: why do you like living where you live? Some of them might be considering moving to the city I live in for work, some of them are thinking about leaving, some are happy here.\nUltimately, everyone is different and what makes some happy might not be for the rest. Some friends want to live in larger cities, others want different climates, others want to move in with their long distance relationship partners, etc. Back in 2015 I was finishing my Ph.D. and thinking about moving somewhere else in 2016. So I started to disengage from friends and the city itself. In the past couple of years, I’ve tried to change my attitude. Or well, adopt my parents’ attitude and follow their lead.\nI frequently compared my current city versus my home city. This comparison used to be skewed in favor of my home city: my current city didn’t have the tacos I loved, or the quesadillas at the market, or my family, childhood friends, etc. At some point I started to point out in my head what my current city has that my home city doesn’t have or isn’t as accessible. One of them is a large open, free and largely secure park where you can ride a bike or play tennis like Patterson Park. So I pushed myself to go biking and play tennis in 2018. I also found a Mexican restaurant that feels like home. I made new friends that understood aspects of me that I didn’t show as much to others here, mostly due to cultural differences. And I started going more frequently to listen to the Baltimore Symphony Orchestra (BSO). So my advice for those who find their current city lacking versus their ideal city or hometown is to start looking for the activities that might be inaccessible elsewhere and that you enjoy. I really like the BSO, so I’ll get into more details about it.\nFirst symphony I really enjoy the BSO events and the story starts back in six grade in Madison, Wisconsin. That was my only year there and the school assigned me^[I don’t know if my parents chose for me.] to the chorus. That was new to me and I liked it quite a bit. At some point the chorus teacher offered some free tickets for a couple of students and their families to attend an event at a Madison symphony with a soprano solo. I don’t remember the name of the symphony nor the solo, but I was like, “sure, why not? Can I get the tickets?”. I knew that my family liked classical music and the teacher was happy that a student showed interest in the tickets. I had taken classical guitar lessons when I was younger because my dad loved it and we had several classical music CDs at home. I was blown away by the soprano solo despite my mom forcing me to dress up hehe. The second and last time the chorus teacher offered tickets, I was eager to get them, and we greatly enjoyed the event.\nClassical music here and there Across the years in Mexico, we would sometimes go to UNAM’s Sala Nezahualcóyotl. But it was always a bit of a trek: about 1.5 hr drive, early on the weekend, etc. It was maybe a bit too much and we would frequently get sleepy. I mostly listened to The Planets or Overture 1812 at home and particularly in family road trips. I remember one time crossing Aguascalientes where we had the volume super high during a portion where the symphony plays very low, and then boom, the symphony gets loud and my mom and brother were on the back of the car and complained quite a bit, but my dad and myself were really into it. So listening to the symphony reminds me about good times with my family.\nBSO during grad school The BSO offers student rush tickets for 10 USD the day of the event as well as a BSO student passport^[It’s now called BSO student select.] which is worth it if you go to 4 or more events in a season. Check the discount programs for more information. Through a combination of both I went several times to the BSO in my 5 years of graduate studies. But most importantly, I went to the season finales which tend to be on the first week of June. The season finale in 2012 was just after my masters comprehensive exam, and the one in 2013 was also just after my Ph.D. comprehensive exam. Both exams were brutal to study for and the BSO season finales were an incredible release of tension and energy for me. I felt many emotions during both finales and loved them dearly (they also featured choruses!). Over the years I went to many events and there was even a season when several of my grad school friends and I got the BSO student passports.\nBSO since After graduating, I got a BSO passport which is a great opportunity for those under 40 years old (nowadays it’s 99 USD) to attend as many events as you want in the season. I started to use the symphony as a way to work through my anxiety issues and mostly didn’t bother to invite friends. While that worked for me, in the 2018-2019 season I’ve been more proactive at inviting friends. I love it when a friend who hasn’t experienced the …","date":1549929600,"expirydate":-62135596800,"kind":"page","lang":"en","lastmod":1689109377,"objectID":"0d015bfdae31b89f00a032ea65ff2854","permalink":"https://lcolladotor.github.io/2019/02/12/why-do-you-like-living-where-you-live/","publishdate":"2019-02-12T00:00:00Z","relpermalink":"/2019/02/12/why-do-you-like-living-where-you-live/","section":"post","summary":"In the past months I’ve had a recurrent conversation with many people. This conversation is typically started with the question: why do you like living where you live? Some of them might be considering moving to the city I live in for work, some of them are thinking about leaving, some are happy here.","tags":["Baltimore","work-life"],"title":"Why do you like living where you live?","type":"post"},{"authors":null,"categories":["rstats","Misc"],"content":"This week the owner of my favorite Mexican restaurant in Baltimore, Rosalyn Vera, got death and arson1 threats. I could have been a bystander, but I tapped into my network and asked for help and she has received it. It’s been great to see the power of the community in action.\nThe backstory So, I use R and Bioconductor for work and I get to witness the warmth and mostly friendly #rstats community where daily people ask for help and get it. Born from the R community is the RLadies organization that provides a platform for non-cis gendered males to share their knowledge and increase their visibility. In one of the RLadies Baltimore events, I met a Data Journalist from the Baltimore Sun, Christine Zhang who gave an excellent talk on how she uses R for her job: for example, election maps.\nAs you know, I’m Mexican. To get over my homesickness these past months I’ve been a frequent customer at a small Mexican restaurant in Baltimore called Cocina Luchadoras. I also frequent live shows from a band called Bad Hombres that plays covers of Spanish rock songs from the 80s and 90s, go to Latin karaoke nights organized by Root Raíces, among other things that bring me joy2.\nInitial threats and reactions To warm up this week, I went to get some atole de arroz at Cocina Luchadoras twice. The second time was just about an hour after Rosalyn received death and arson threats on Thursday. I could tell that she was scared but she was also incredibly brave. The threats were because she has placed a sign on her restaurant to support the Donald fundraising campaign from Ilegal Mezcal that says “Donald, eres un pendejo” (Donald, you are stupid) . The person making the threats mentioned that immigrants are taking away jobs from US citizens. As a Hispanic customer, I got scared as well and became suspicious of whoever entered the restaurant.\nSo, what does one do? How would you react to a hate crime threat? Or well, any threat? Call the police. Do you comply with the request to take down the poster? Hire security? Close and move to a different location? I feel like situations like this put can you at odds between following your ideals and being pragmatic. In this case, Rosalyn had to decide whether to stand by her free speech rights or not.\nIn the United States of America you expect that the police and the institutions that protect the law will help you. Unlike Guatemala in the 1960s when the police/military tried to silence/kill my grandfather due to the health clinic he and my grandmother had where they would treat people from many backgrounds: he closed down, moved to Mexico, and had to be pragmatic and abandon some of his ideals. Or unlike Mexico in recent times, where there’s widespread insecurity due to the war on drugs, corruption, etc. For example, my father’s house was broken into, he got tied down and was punched until a few ribs broke: he called a Mexican military veteran for help.\nSo, here in the US, you call the police and wait for them to do their job. But you can also decide to ask for help from your community. So I offered Rosalyn my time and network, and she accepted. This was tricky as I told her, because I didn’t want to either give a platform for the person making the threats or to attract other people like him.\nI asked Christine for help on whom to talk to at the Baltimore Sun, and she responded immediately. After some emails and knocking on a couple more doors, the Baltimore Sun published an article by Lillian E Reed with contributions by Thalia Juarez and Catherine Rentz. Catherine has published some great work on hate crimes in Maryland and they’ve made an interactive map to browse the data. From there, the word kept spreading and many started to show their support: Baltimore Reddit, local politicians, and many regular Cocina Luchadores customers.\nThe threats continue I went again on Saturday and the place was packed and things seemed to be trending on the right direction. The police had called and were supposed to meet with Rosalyn later. Instead, they didn’t show up and the person making the threats called again…\nFrom an allocation of limited resources, I understand that the Baltimore Police has many things to do and many people to keep safe. Catherine Rentz’ story on hate crimes in Maryland from 2016 and 2017 highlights that this type of crime is likely underreported and that there are very few convictions. Maybe this went through the mind of the policeman who did the report on Thursday: “threat phone call? No witnesses? Ok, not enough evidence… move on”.\nI had a very hard time processing the no-show by the police though. Talking to others, we discussed how the law enforcement system is overworked (they are reducing the police officer shift length soon) and swamped. But hey, there’s a supportive community. So I asked for help again. “Who knows someone at the Baltimore Police?” That was the question and soon enough one friend replied, and then emailed a lieutenant. By the next morning (Sunday/today), the …","date":1549152000,"expirydate":-62135596800,"kind":"page","lang":"en","lastmod":1689109377,"objectID":"42ecb16f45a1cff92544a265869904c3","permalink":"https://lcolladotor.github.io/2019/02/03/the-power-of-tapping-into-your-community-for-support/","publishdate":"2019-02-03T00:00:00Z","relpermalink":"/2019/02/03/the-power-of-tapping-into-your-community-for-support/","section":"post","summary":"This week the owner of my favorite Mexican restaurant in Baltimore, Rosalyn Vera, got death and arson1 threats. I could have been a bystander, but I tapped into my network and asked for help and she has received it.","tags":["politics","Diversity","Baltimore"],"title":"The power of tapping into your community for support","type":"post"},{"authors":["Stephen A Semick","Rahul A Bharadwaj","Leonardo Collado-Torres","Ran Tao","Joo Heon Shin","Amy Deep-Soboslay","James Weiss","Daniel R Weinberger","Thomas M Hyde","Joel E Kleinman","Andrew E Jaffe \u0026dagger;","Venkata S Mattay \u0026dagger;"],"categories":null,"content":" Fresh off the press: Integrated DNA methylation and gene expression profling across multiple brain regions implicate novel genes in Alzheimer’s diseasehttps://t.co/a35BM6decX\nLead by @SteveSemick with all @LieberInstitute co-authors GEO: GSE125895 Code: https://t.co/UoXVFShSo6 pic.twitter.com/5DbfEkq0Fo\n— 🇲🇽 Leonardo Collado-Torres (@lcolladotor) February 4, 2019 ","date":1549065600,"expirydate":-62135596800,"kind":"page","lang":"en","lastmod":1651425968,"objectID":"3ce40aa6ede33a5aefbdd864a59700b0","permalink":"https://lcolladotor.github.io/publication/2019-02_dnam_alzheimer/","publishdate":"2019-02-02T00:00:00Z","relpermalink":"/publication/2019-02_dnam_alzheimer/","section":"publication","summary":"Late-onset Alzheimer’s disease (AD) is a complex age-related neurodegenerative disorder that likely involves epigenetic factors. To better understand the epigenetic state associated with AD, we surveyed 420,852 DNA methylation (DNAm) sites from neurotypical controls (N=49) and late-onset AD patients (N=24) across four brain regions (hippocampus, entorhinal cortex, dorsolateral prefrontal cortex and cerebellum). We identified 858 sites with robust differential methylation collectively annotated to 772 possible genes (FDR\u003c5%, within 10 kb). These sites were overrepresented in AD genetic risk loci (p=0.00655) and were enriched for changes during normal aging (p\u003c2.2×10−16), and nearby genes were enriched for processes related to cell-adhesion, immunity, and calcium homeostasis (FDR\u003c5%). To functionally validate these associations, we generated and analyzed corresponding transcriptome data to prioritize 130 genes within 10 kb of the differentially methylated sites. These 130 genes were differentially expressed between AD cases and controls and their expression was associated with nearby DNAm (p\u003c0.05). This integrated analysis implicates novel genes in Alzheimer’s disease, such as ANKRD30B. These results highlight DNAm differences in Alzheimer’s disease that have gene expression correlates, further implicating DNAm as an epigenetic mechanism underlying pathological molecular changes associated with AD. Furthermore, our framework illustrates the value of integrating epigenetic and transcriptomic data for understanding complex disease.","tags":["DNAm"],"title":"Integrated DNA methylation and gene expression profiling across multiple brain regions implicate novel genes in Alzheimer's disease","type":"publication"},{"authors":["Leonardo Collado-Torres"],"categories":null,"content":" ","date":1546705445,"expirydate":-62135596800,"kind":"page","lang":"en","lastmod":1621020950,"objectID":"484c1b5e1586e9f5aad0089a33843395","permalink":"https://lcolladotor.github.io/talk/psb2019/","publishdate":"2019-01-05T16:24:05Z","relpermalink":"/talk/psb2019/","section":"talk","summary":"Junior Research Symbiont Award Presentation for Excellence in Data Sharing at PSB2019","tags":["recount2"],"title":"Reproducible RNA-seq analysis with recount2","type":"talk"},{"authors":["Leonardo Collado-Torres"],"categories":null,"content":" ","date":1543508645,"expirydate":-62135596800,"kind":"page","lang":"en","lastmod":1621020950,"objectID":"d6163e60afd6e8b1e92f37ce7563ad60","permalink":"https://lcolladotor.github.io/talk/jgm2018/","publishdate":"2018-11-29T16:24:05Z","relpermalink":"/talk/jgm2018/","section":"talk","summary":"Work in progress presentation on recount-brain for the Joint Genomics Meeting","tags":["Joint Genomics Meeting","recount brain","recount2"],"title":"Reproducible RNA-seq analysis with recount2 and recount-brain","type":"talk"},{"authors":["Helena Kuri-Magaña","Leonardo Collado-Torres","Andrew E Jaffe","Humberto Valdovinos-Torres","Marbella Ovilla-Muñoz","Juan M Téllez-Sosa","Laura C Bonifaz-Alfonzo","Jesús Martínez-Barnetche"],"categories":null,"content":" Our paper with @helenakuri @jmbarnet @andrewejaffe on \u0026#34;Non-coding Class Switch Recombination-Related Transcription in Human Normal \u0026amp; Pathological Immune Response\u0026#34; is now published at @FrontImmunol 🎉https://t.co/XqNMkkH0Ba@LieberInstitute @inspmx #recount2 #RNAseq @Conacyt_MX https://t.co/JFHkXC65cw\n— 🇲🇽 Leonardo Collado-Torres (@lcolladotor) November 21, 2018 ","date":1542758400,"expirydate":-62135596800,"kind":"page","lang":"en","lastmod":1651425968,"objectID":"daadd93d3b6c794cabded96f77f972f0","permalink":"https://lcolladotor.github.io/publication/2018-11_nccsr/","publishdate":"2018-11-21T00:00:00Z","relpermalink":"/publication/2018-11_nccsr/","section":"publication","summary":"Background: Antibody class switch recombination (CSR) to IgG, IgA or IgE is a hallmark of adaptive immunity, allowing antibody function diversification beyond IgM. CSR involves a deletion of the IgM/IgD constant region genes placing a new acceptor Constant (CH) gene, downstream of the VDJH exon. CSR depends on non-coding (CSRnc) transcription of donor Iμ and acceptor IH exons, located 5′ upstream of each CH coding gene. Although our knowledge of the role of CSRnc transcription has advanced greatly, its extension and importance in healthy and diseased humans is scarce. Methods: We analyzed CSRnc transcription in 70,603 publicly available RNA-seq samples, including GTEx, TCGA and the Sequence Read Archive (SRA) using recount2, an online resource consisting of normalized RNA-seq gene and exon counts, as well as coverage BigWig files that can be programmatically accessed through R. CSRnc transcription was validated with a qRT-PCR assay for Iμ, Iγ1 and Iγ3 in humans in response to vaccination. Results: We mapped IH transcription for the human IgH locus, including the less understood IGHD gene. CSRnc transcription was restricted to B cells and is widely distributed in normal adult tissues, but predominant in blood, spleen, MALT-containing tissues, visceral adipose tissue and some so-called 'immune privileged' tissues. However, significant Iγ4 expression was found even in non-lymphoid fetal tissues. CSRnc expression in cancer tissues mimicked the expression of their normal counterparts, with notable pattern changes in some common cancer subsets. CSRnc transcription in tumors appears to result from tumor infiltration by B cells, since CSRnc transcription was not detected in corresponding tumor-derived immortal cell lines. Additionally, significantly increased Iδ transcription in ileal mucosa in Crohn's disease with ulceration was found. Conclusions: CSRnc transcription occurs in multiple anatomical locations beyond classical secondary lymphoid organs, representing a potentially useful marker of effector B cell responses in normal and pathological immune responses. The pattern of IH exon expression may reveal clues of the local immune response (i.e. cytokine milieu) in health and disease. This is a great example of how the public recount2 data can be used to further our understanding of transcription, including regions outside the known transcriptome.","tags":["recount2"],"title":"Non-coding Class Switch Recombination-Related Transcription in Human Normal and Pathological Immune Responses","type":"publication"},{"authors":null,"categories":["Computing","Misc","rstats"],"content":"Recently I’ve been thinking on the subject of asking for help. In short, it’s hard to ask for help. It involves admitting to yourself that you can’t solve the problem alone, opening yourself up, hoping that another person will understand you and guide you in the right direction. Thus it can be painful if your request for help is misunderstood, met with criticism or ignored. Regardless of these obstacles, I think that the potential rewards make it worth it.\nI mostly encounter the situation of asking for help in two scenarios. One is about work, mostly R programming. The other one is about personal issues. There are plenty more, like spelling, cultural references, word definitions and academic citations.\nThank you!\nI’m always learning more English! Last night it was “yule” via @BenLangmead and others#DeepLearning? 🙃 pic.twitter.com/kX9JTnSBAn\n— 🇲🇽 Leonardo Collado-Torres (@lcolladotor) November 10, 2018 PCR was invented by Kary Mullis in 1984. He won the Nobel Prize in chemistry for it in 1993. real-time PCR (qPCR) was developed about ten years later and originates with this paper: https://t.co/gpIOr3s7PG\n— Lior Pachter (@lpachter) November 10, 2018 Programming context In the context of R and Bioconductor, and programming in general, it can be scary to ask for help in public forums such as a GitHub issue page, the Bioconductor Support website, the RStudio Community website, etc. That’s because you might get a very short reply that can seem unhelpful if it involves terms you are not familiar with (though it might be a precise reply). There are also issues with online communities that I won’t get into. Over the years, I’ve tried to help those who will potentially answer my questions by:\nDouble checking the documentation1. Providing information to reproduce my problem: sometimes doing so makes me realize my mistake. Trying for a while (\u0026gt;20 min?) to solve the problem by myself which involves googling quite a bit. However, sometimes I’m not aware of the correct search terms. Avoiding sounding like I’m demanding help, asking for help immediately or requesting the same person for help lots of times in a short time window2. I’ve also tried to highlight my main question, though this can be hard when you are not sure what’s wrong.\nWhen I get a short reply that seems unfriendly, I try to be appreciative of the time this other person took to reply to me. The terms they use in their reply can be important clues on what to search on Google next.\nLanguage matters and I hate it when others make me feel dumb instead of guiding me to the right documentation/website, while others might dislike receiving tons of loose ended questions. Ultimately, this process requires patience on both sides and I highly value efforts by others that try to make it easier for both the person asking for help and the person responding. See for example:\nHelp me help you. Creating reproducible examples - Jenny Bryan Get help – tidyverse version Getting Help with R How to ask for help for Bioconductor packages (which I wrote) Here are some my recent requests for help with replies by others:\nENCODE-DCC ATAC-seq pipeline bioc-devel macOS Mojave building from source issue rJava with R 3.6 and macOS Mojave bioc-devel NAMESPACE issue I still make mistakes by not been clear enough sometimes, that’s why I typically say: “please let me know if you need more information” or something along those lines.\nPersonal context Asking for help in a programming context is hard because you are leaving your questions public (most of the time): that way you can reach multiple people that can potentially answer your question, and the people answering the question want them to be public with the hope that the answers will help others. Asking for help in personal context is different, since it tends to be in private.\nThis might just be me, but I’ve had several situations in my life where I’ve opened up and asked a group of individuals for help. For example, I recently started a conversation with several friends about ways to limit alcohol consumption. It was scary at first to bring this topic up, but the friends I talked to about this subject had also been thinking about it and it lead to some great conversations. I have other examples listed in my timeline3 on occasions where others have helped me with career advice.\nOne story that I want to share now is about grad school. I was a first year student and I had an accident one Friday in February. I knew immediately that I needed a surgery to repair my shoulder. I already had experience with orthopedic surgeons in Mexico whose quality was widely variable: it took my family years to find one we could trust for my first surgery. In my first year at a new city and country, I didn’t have my family’s network support. So I reached out via email to the faculty that I had met in person with the hopes that one of them knew a good orthopedic surgeon. This was a personal help request, so I didn’t use the Department wide mailing list. The …","date":1541980800,"expirydate":-62135596800,"kind":"page","lang":"en","lastmod":1689109377,"objectID":"2bdf3d13cbe60472dda262abe490b80f","permalink":"https://lcolladotor.github.io/2018/11/12/asking-for-help-is-challenging-but-is-typically-worth-it/","publishdate":"2018-11-12T00:00:00Z","relpermalink":"/2018/11/12/asking-for-help-is-challenging-but-is-typically-worth-it/","section":"post","summary":"Recently I’ve been thinking on the subject of asking for help. In short, it’s hard to ask for help. It involves admitting to yourself that you can’t solve the problem alone, opening yourself up, hoping that another person will understand you and guide you in the right direction.","tags":["Computing","Help","Science"],"title":"Asking for help is challenging but is typically worth it","type":"post"},{"authors":null,"categories":["Conference","Misc","UNAM","rstats"],"content":"I can’t tell you how many times I’ve started to write this post in my mind since May 2018. Today I’m finally typing it on the computer. This will be a rather long post that ties in several threads. I’ll talk about Cold Spring Harbor’s Biology of Genomes conference and its relationship to my undergrad in Mexico. I’ll also introduce you to Aldo Barrientos (1987-2011) who was was my undergrad classmate. Then I’ll tell you about myself and how regardless of your situation, privileged or not, you should ask for help and get to know the people around you. Finally, I want to highlight that many other Mexican researchers are doing great work and would love to be invited to talk about their work. Or simply, the opportunity to compete for scholarships and grants.\nCSHL and LCG-UNAM This past May I was selected to give a talk at Biology of Genomes 2018 (BOG) at Cold Spring Harbor Laboratory (CSHL). This was my first time being there and I had plenty of time to reflect before my talk1. For me, attending BOG was like a dream come true so I was blown away when I was selected to present at BOG.\nI first heard about the BOG conference when I was studying my undergrad in Mexico at LCG-UNAM. My class has a history with the conference too. Basically, part of the class was meeting to discuss what optional courses to create for our fourth year, and well, some miscommunication happened among us. This created a rift in the group and was one of my motivations for focusing on communication as well as giving back. The former lead to me being elected as class president and the latter lead to me volunteering to teach R courses later on my undergrad2.\nAs BOG18 went underway, some of my fellow junior presenters started their talks by mentioning why CSHL was special to them. Following their cue, I wrote some notes just before my presentation.\nI really wanted to give a shoutout to all my LCG-UNAM classmates. I also thought of Aldo Barrientos and how it could have been him at BOG. This got me nervous, but I really wanted to do it. I also wanted this to be short and professional. You can see how it turned out for yourself3.\nAldo Barrientos It’s time for me to tell you more about Aldo Barrientos, my LCG-UNAM classmate. I won’t attempt to tell you his whole story since I think that others could write a much more detailed one that myself. I hope they do and if they are made public, I’ll share them from this blog post.\nAldo came from a low income family in Mexico: I believe that his father was a construction worker4. He was smart and advanced through school successfully. He took the entry exam for LCG-UNAM like many people did in 2005. Eventually only around 10-15 percent of the applicants were admitted to this undergrad program. The school was free (25 Mexican cents per year), but it involved relocating to a new city. UNAM has some scholarship programs, but they are not enough. Aldo found a way like he always did. For example, he sold candy and juice to his classmates during lunch break. For reasons that I don’t remember, Aldo didn’t complete his undergrad in 2009 but was about to in 2011.\nI remember Aldo as a very joyful person who was always smiling and joking with the rest of us. He had the best dancing skills of anyone at my undergrad. He proved them time and time again, for example winning a dance contest at a party in my house and wearing the Pumas UNAM puma costume in our graduation party and dancing with everyone.\nImage source\nHis path was cut abruptly in 2011. He was stabbed multiple times while waiting for someone. We all knew about this. It’s still unclear to me how everything happened in the following months. But I remember being told that he tried seeing a doctor before going back to his home. One day in 2011, we all started to learn about how grave his situation had turned. I didn’t know what to do5 and I talked to David Romero, director (dean?) of CCG-UNAM back then. He guided me and others and we were trying to coordinate ways to help Aldo, but by the time we got to his home it was too late. I regret that we weren’t able to help Aldo earlier.\nI still have some emails from 2011 when we were talking about doing something to honour him. We never did as a class, though LCG-UNAM did acknowledge him. Maybe one day we will do an event to remember him.\nAldo faced more challenges that myself and other classmates. Yet I believe that he would have kept solving them one by one; he would have gotten his undergrad degree and had he chosen to stay in academia, then present his research findings at conferences like BOG.\nPrivileged yes, entitled no Thinking about Aldo made reflect also on who has been around in my own path, who has helped me and how grateful I am to them. Undoubtedly I’ve had an easier path than others including Aldo. That is, I’ve been privileged.\nStill, even with my privileged position it has been a hard fought battle to get to where I am now. I think that a mistake others do is that they assume that they are entitled to …","date":1541462400,"expirydate":-62135596800,"kind":"page","lang":"en","lastmod":1689109377,"objectID":"cc5a4ec0841389eb56f7ecb96f592207","permalink":"https://lcolladotor.github.io/2018/11/06/a-knot-of-threads-from-cshl-to-lcg-unam-to-aldo-barrientos-to-diversity-scholarship-opportunities/","publishdate":"2018-11-06T00:00:00Z","relpermalink":"/2018/11/06/a-knot-of-threads-from-cshl-to-lcg-unam-to-aldo-barrientos-to-diversity-scholarship-opportunities/","section":"post","summary":"I can’t tell you how many times I’ve started to write this post in my mind since May 2018. Today I’m finally typing it on the computer. This will be a rather long post that ties in several threads.","tags":["Academia","Diversity","LCG","Science"],"title":"A knot of threads: from CSHL to LCG-UNAM to Aldo Barrientos to diversity scholarship opportunities","type":"post"},{"authors":null,"categories":["Conference","rstats"],"content":"I recently wrote several blog posts with many tweets1 as a way of taking notes during the American Society of Human Genetics 2018 conference. A few friends asked me how I did this so fast. The process can be summarized into the following main steps.\nSave links of tweets you want to highlight in your post. Use a hugo-powered blog to obtain the code for embedding tweets easily2. Proofread, edit and post. My steps detailed Here’s the actual process I used.\nIdentify the conference Twitter hashtag. In my recent case, that was ASHG18.\nCreate a Google doc or some other simple text file you can access easily from your phone and laptop.\nWhile in a presentation, check the latest tweets for the given hashtag. ASGH18 example.\nCopy the link of any tweet you find interesting. If there are none for the session you are in, consider writing some tweets yourself with the conference hashtag! Paste the link into your Google doc. Once the day is over, copy-paste the contents of your Google doc into a text editor that has the ability to find and replace using regular expressions. For example, TextMate. Find and replace to create the syntax for embedding tweets. I’ll cover more of this in detail in the next section. Find:\nhttps://twitter.com/.*/status/ and replace by:\n\\n`r blogdown::shortcode(\u0026#34;tweet\u0026#34;, \u0026#34; Then find:\n\\?s=[0-9]* and replace by:\n\u0026#34;)`\\n Our file now looks like this:\nAdd any comments you wish, format the headings and proofread.\nMake it public and tweet about your post with the conference hashtag!\nAnd you are done! 🙌🏽🎉\nQuick embedding Note that my blog is powered by blogdown (Xie, Hill, and Thomas, 2017) which has the function blogdown::shortcode() for embedding tweets. For example, blogdown::shortcode(\u0026#34;tweet\u0026#34;, user=\u0026#34;lcolladotor\u0026#34;, id=\u0026#34;1054380320533950464\u0026#34;) generates the hugo syntax code which then hugo renders into the tweet itself.\nI just completed my #ASHG18 survey @GeneticsSociety. Took a few minutes and most of my feedback wouldn\u0026#39;t stand out. Except that I did use a box to suggest having a webinar with role playing scenarios that exemplify how the code of conduct can be used to diffuse harassment @jsdron pic.twitter.com/AKZdnGCr25\n— 🇲🇽 Leonardo Collado-Torres (@lcolladotor) October 22, 2018 As an alternative, we can use Twitter itself by copy-pasting the code for embedding the tweet directly from the Twitter app/website. On the top right side menu on the tweet itself, select Embed Tweet\nthen copy-paste the HTML code into your post.\nHere’s the code:\n\u0026lt;blockquote class=\u0026#34;twitter-tweet\u0026#34; data-lang=\u0026#34;en\u0026#34;\u0026gt;\u0026lt;p lang=\u0026#34;en\u0026#34; dir=\u0026#34;ltr\u0026#34;\u0026gt;I just completed my \u0026lt;a href=\u0026#34;https://twitter.com/hashtag/ASHG18?src=hash\u0026amp;amp;ref_src=twsrc%5Etfw\u0026#34;\u0026gt;#ASHG18\u0026lt;/a\u0026gt; survey \u0026lt;a href=\u0026#34;https://twitter.com/GeneticsSociety?ref_src=twsrc%5Etfw\u0026#34;\u0026gt;@GeneticsSociety\u0026lt;/a\u0026gt;. Took a few minutes and most of my feedback wouldn\u0026amp;#39;t stand out. Except that I did use a box to suggest having a webinar with role playing scenarios that exemplify how the code of conduct can be used to diffuse harassment \u0026lt;a href=\u0026#34;https://twitter.com/jsdron?ref_src=twsrc%5Etfw\u0026#34;\u0026gt;@jsdron\u0026lt;/a\u0026gt; \u0026lt;a href=\u0026#34;https://t.co/AKZdnGCr25\u0026#34;\u0026gt;pic.twitter.com/AKZdnGCr25\u0026lt;/a\u0026gt;\u0026lt;/p\u0026gt;\u0026amp;mdash; 🇲🇽 Dr. Leonardo Collado-Torres (@fellgernon) \u0026lt;a href=\u0026#34;https://twitter.com/lcolladotor/status/1054380320533950464?ref_src=twsrc%5Etfw\u0026#34;\u0026gt;October 22, 2018\u0026lt;/a\u0026gt;\u0026lt;/blockquote\u0026gt; \u0026lt;script async src=\u0026#34;https://platform.twitter.com/widgets.js\u0026#34; charset=\u0026#34;utf-8\u0026#34;\u0026gt;\u0026lt;/script\u0026gt; and here is how it looks:\nI just completed my \\#ASHG18 survey (**GeneticsSociety?**). Took a few minutes and most of my feedback wouldn\u0026#39;t stand out. Except that I did use a box to suggest having a webinar with role playing scenarios that exemplify how the code of conduct can be used to diffuse harassment (**jsdron?**) pic.twitter.com/AKZdnGCr25 — 🇲🇽 Dr. Leonardo Collado-Torres ((**fellgernon?**)) October 22, 2018 There might be other ways of doing this that are specific to your blog platform.\nI also imagine that it should be possible to bookmark the tweets on Twitter and then use an R package to extract your bookmarked tweets from the past 24 hours in order to simplify the process. Maybe this can be done with rtweet although I haven’t dived into it.\nNew to blogdown? Check:\nEmily Zabor’s website tutorial The blogdown (Xie, Hill, and Thomas, 2017) book. Alison Presmanes Hill’s blogdown introduction. Also, ask around. You might belong to a group or know someone that is willing to host a guest post in their blogdown blog. For example:\nLIBD rstats club R-Ladies Baltimore R-Ladies NYC Acknowledgments This blog post was made possible thanks to:\nBiocStyle (Oleś, 2023) blogdown (Xie, Hill, and Thomas, 2017) knitcitations (Boettiger, 2021) sessioninfo (Wickham, Chang, Flight, Müller et al., 2021) References \\[1\\] C. Boettiger. knitcitations: Citations for ‘Knitr’ Markdown Files. R package version 1.0.12. 2021. URL: https://CRAN.R-project.org/package=knitcitations. \\[2\\] A. Oleś. BiocStyle: Standard styles for vignettes and other Bioconductor documents. R package version 2.28.0. 2023. DOI: …","date":1540252800,"expirydate":-62135596800,"kind":"page","lang":"en","lastmod":1689109377,"objectID":"bbe32e9bfda5cb75c68ce9fd54f4755c","permalink":"https://lcolladotor.github.io/2018/10/23/steps-for-writing-a-twitter-summary-conference-blog-post/","publishdate":"2018-10-23T00:00:00Z","relpermalink":"/2018/10/23/steps-for-writing-a-twitter-summary-conference-blog-post/","section":"post","summary":"I recently wrote several blog posts with many tweets1 as a way of taking notes during the American Society of Human Genetics 2018 conference. A few friends asked me how I did this so fast.","tags":["ASHG","Blog","rstats"],"title":"Steps for writing a Twitter summary conference blog post","type":"post"},{"authors":null,"categories":["Conference"],"content":"Continuing from my ASHG18 day 1 post, day 2, day 3 and day4 here’s my list of tweets from day 5.\n6C 9:15 am Jane Loveland Wish that gene annotation was consistent across databases? Jane Loveland is speaking about the new #MANE project which aims to converge transcript annotation between @GencodeGenes and @NCBI RefSeq in 30 min 09:15-09:30, Room 6C, Talk 302 #ASHG18\n— Ensembl (@ensembl) October 20, 2018 Jane Loveland: there are two comprehensive transcript annotations, RefSeq and Gencode. Clinical labs use RefSeq, basically everyone else (e.g. gnomAD, GTEx) uses Gencode. Describes the MANE project to unify these annotations. #ASHG18\n— Daniel MacArthur (@dgmacarthur) October 20, 2018 Jane Loveland\nAnnotation project leader. #MANE project is based on GRCh38\nMatched Annotation NCBI and Ensembl (I think)\nLooking for “longest strong” transcripts\nWant stable yet updatable pipeline Many challenges!\n#ASHG18 @ensembl @NCBI\n— 🇲🇽 Leonardo Collado-Torres (@lcolladotor) October 20, 2018 Jane Loveland\nGoals for Phase 2: update remaining 47% genes\nChallenges: missing data for some genes!\nNo cage\nNo polyA\nNo … (missed it)\nA to audience Q: Once they select a transcript, they’ll keep it. #ASHG18\n— 🇲🇽 Leonardo Collado-Torres (@lcolladotor) October 20, 2018 .@princyparsana asked Jane Loveland about overlapping genes. They are addressing this issue! #ASHG18\n— 🇲🇽 Leonardo Collado-Torres (@lcolladotor) October 20, 2018 6B 10 am Genevieve Stein-O’Brien Genevieve Stein-O\u0026#39;Brien describing her package CoGAPS - in Bioconductor - to learn both discrete and continuous axes in single cell data. #ASHG18\n— Nick Banovich (@NeBanovich) October 20, 2018 Yu Hu Yu Hu\nOn using single cell RNA-seq data for detecting differential splicing events\nPresented SCATS and compared to MISO derived results\nCan we recover cluster pattern?\nCheck sensitivity\nSCATS is his thesis projecthttps://t.co/1c52ulw6e3#ASHG18\n— 🇲🇽 Leonardo Collado-Torres (@lcolladotor) October 20, 2018 Mingyao Li and Nancy Zhang were his advisors.\nHierarchical model with normal + (missed it) + log + poisson\n20 BC 10:30 am Stephanie Kravitz @snkravitz Our textbook model of gene expression is that each parental allele is expressed equally. That is, biallelic expression. However, both genetic and epigenetic mechanisms can lead to monoallelic expression; one or mostly one allele is expressed instead of both.\n#ASHG18\n— Aaron Quinlan (@aaronquinlan) October 20, 2018 @snkravitz Her goal is to identify autosomal genes that exhibit monoallelic expression.#ASHG18\n— Aaron Quinlan (@aaronquinlan) October 20, 2018 @snkravitz Low madRD indicates biallelic expression. High madRD indicates monoallelic expression. madRD robustly distinguishes genes on the X from autosomal.#ASHG18\n— Aaron Quinlan (@aaronquinlan) October 20, 2018 @snkravitz Goal is to build a map of tissue-specific genes that exhibit monoallelic expression. Distinguish genetic (e.g., eQTL) and epigenetic effects. How does allelic expression modulate the penetrance of disease alleles?#ASHG18\n— Aaron Quinlan (@aaronquinlan) October 20, 2018 Li Chen Li Chen\nLooking at eQTL associations with SNVs. Developed TIVAN pipeline for fine mapping eQTL SNVs. Compared against other methods. Used GTEx v7 data + eQTL data from other studies (missed the full list)#ASHG18\n— 🇲🇽 Leonardo Collado-Torres (@lcolladotor) October 20, 2018 Li Chen\nTested model using:\n* Cross validation * Leave-One-Chromosome-Out (LOCO strategy); means crazy 😜 in Spanish 🇪🇸 🇲🇽 #ASHG18\n— 🇲🇽 Leonardo Collado-Torres (@lcolladotor) October 20, 2018 Li Chen handled very well a question on “have you compared to X new paper?” with “great question, paper X didn’t come up in our literature review but we’kk look into it”\nLi Chen also gave a shoutout to his trainee in computer science who did most of the work #ASHG18\n— 🇲🇽 Leonardo Collado-Torres (@lcolladotor) October 20, 2018 Nicholas Bogard Nicholas Bogard\nLast talk of the conference! 👋🏽 Using a Deep Neural Net with lots of data. 🌊 Looked a PolyA signal (PAS) sequence. Built a APA reporter library (generated over 3 million unique PAS)\nBuilt APARENT: APA regression net with computational collaborator#ASHG18\n— 🇲🇽 Leonardo Collado-Torres (@lcolladotor) October 20, 2018 Nicholas Bogard\nLooked at predicted results from APARENT and proximal/distal PAS (pPAS/dPAS). SNVs, ClinVar, CES (a short sequence) mutation impact Also looked at the distribution of predicted cuts#ASHG18\n— 🇲🇽 Leonardo Collado-Torres (@lcolladotor) October 20, 2018 Other Plewcczynski #ASHG18 Now collab with JAX; 4D Nucleome NIH project described here https://t.co/CP6ZmPR1ta Sequence infl chromatin structure\n— Dale Yuzuki (@DaleYuzuki) October 20, 2018 .@tuuliel discussed v8 of GTEx release which should be out this coming winter. ~17K samples, 54 tissues, 838 donors. 24K eQTLs but only \u0026lt;200 trans-eQTLs. #ASHG18 #ASHG2018\n— Jason Miller (@JEMgenes) October 20, 2018 DW: PsychENCODE and other consortia genomics data integrated to understand functional genomics of brain disorders. …","date":1539993600,"expirydate":-62135596800,"kind":"page","lang":"en","lastmod":1689109377,"objectID":"40602ae4de84b0bf033f919ed657af9b","permalink":"https://lcolladotor.github.io/2018/10/20/ashg18-tweet-summary-day-5/","publishdate":"2018-10-20T00:00:00Z","relpermalink":"/2018/10/20/ashg18-tweet-summary-day-5/","section":"post","summary":"Continuing from my ASHG18 day 1 post, day 2, day 3 and day4 here’s my list of tweets from day 5.\n6C 9:15 am Jane Loveland Wish that gene annotation was consistent across databases?","tags":["ASHG"],"title":"ASHG18 tweet summary day 5","type":"post"},{"authors":null,"categories":["Conference"],"content":"Continuing from my ASHG18 day 1 post, day 2, day 3 here’s my list of tweets from day 4.\n6F 11:00 am Cecilia Lingdren Got there at the end :P\nHad #diversitymatters and many flags including the rainbow one in her last slide.\nBenjamin Neale .@bmneale points out dimorphism in research participation - women more likely to participate (generally and in UK Biobank) and yet comparatively understudied #ASHG18\n— Avery Davis Bell, PhD (@averydavisbell) October 19, 2018 In the sex dimorphism session, @bmneale points out that in UKBB (as is true for many studies) there are more women than men. More women participate in research and remain in studies, but are actually studied less. #ASHG18\n— Sara Pulit (@saralpulit) October 19, 2018 Benjamin Neale\nUK Biobank has a great model for sharing data. Straightforward to request access and start collaborating with other human geneticists. @uk_biobank #ASHG18\n— 🇲🇽 Leonardo Collado-Torres (@lcolladotor) October 19, 2018 Ben Neale @bmneale on Round 2 of @uk_biobank GWAS: Added new imputed data, chrX variants, and VEP missense and PTVs with MAF \u0026gt; 1e-6; net 3M more variants. Also ran sex-specific GWAS. Looking forward to updating Open Targets Genetics with this release! #ASHG18\n— Ellen Schmidt (@ellenmschmidt) October 19, 2018 All results are available to download for free from his lab website!\nBarbara Stranger Barbara Stranger @be_stranger Sex differences in: expression, splicing, interaction cOs-QTLs, allele-specific expression bias\nData from GTEx @GTExPortal Work with @princyparsana @alexisjbattle among others #ASHG18\n— 🇲🇽 Leonardo Collado-Torres (@lcolladotor) October 19, 2018 Other (morning) Tissue cell type composition in Gtex changes with age, sometimes in a sex-specific manner #ASHG18\n— Misha Vysotskiy (@Misha_Vysotskiy) October 19, 2018 Now: @julirsch does finemapping to find specific causal variants associated with blood cell traits. 230 genes contain fine-mapped coding variants #ASHG18\n— Art Wuster (@artwuster) October 19, 2018 @princyparsana: \u0026#34;Addressing confounding artifacts in reconstruction of gene co-expression networks\u0026#34; https://t.co/9Tj85Furxd #ASHG18\n— Damien C-C (@dccc_phd) October 19, 2018 M Snyder: Under GTEX consortium, the proteomics project mapped 32 normal human tissues, together have identified ~16k proteins from 14K genes. #ASHG18 #ASHG2018\n— Dawei Lin (@iGenomics) October 19, 2018 Afternoon I like Cecelia Lundgren’s emphasis on #mutualcontract of mentoring. Altshuler - “don’t bring the problem, bring the solution. Nice contrast to the typical “solve important problem” advice (which is also true).#ASHG18\n— Sharon Plon (@splon) October 19, 2018 Cecilia Lundgren - it’s not “work-life” balance it is “work-home” balance as work is part of our lives! Love that!! She doesn’t email students over week-ends. She takes vacation. #ashg18\n— Sharon Plon (@splon) October 19, 2018 CL: Science should embrace everyone, regardless of color, sexual orientation, religion, culture, etc. Diversity matters. A key fundamental part of genetics. [this was the best award recipient talk ever] #ASHG18\n— Michael Hoffman @michaelhoffman.bsky.social (@michaelhoffman) October 19, 2018 Really inspiring talk from Cecilia Lindgren accepting this year’s #ASHG18 Mentorship Award highlighting diversity, work-life balance, value of finding the best work environment for you. Science does not see sex, race, color #diversitymatters\n— Claudia Gonzaga-Jauregui (@cgonzagaj) October 19, 2018 As a woman scientist it’s extremely inspiring to see women role models like this year’s #ASHG18 awardees @ceclindgren \u0026amp; Mary-Claire King and others like @splon @NancyGenetics share their stories, their wisdom, and their opinions #RepresentationMatters\n— Claudia Gonzaga-Jauregui (@cgonzagaj) October 19, 2018 A moving acceptance speech by @ceclindgren on her #ASHG18 Mentorship award calling for inclusion, diversity, and assertiveness rather than aggression. Congrats! pic.twitter.com/3HQ5kle7Hu\n— Chris Cole (@_chriscole_) October 19, 2018 CL: Advice:\n- Lean in/hang on step up\n- Be positive, persistent, polite\n- Assertiveness ≠ aggression\n- Choose a work environment supportive of you\n- Choose a mentor supportive of you\n- Choose a mentor that you can buy into and respect #ASHG18\n— Michael Hoffman @michaelhoffman.bsky.social (@michaelhoffman) October 19, 2018 Diversity I prefer women/men or female/male - they’re not perfect since human gender and sex aren’t binary but they do a decent job as short hand. “Boys and girls” feels needlessly (verging in offensivey) infantilizing and perhaps extra gendered. #ASHG18\n— Avery Davis Bell, PhD (@averydavisbell) October 19, 2018 Re-posting an example how I try to talk about (or avoid unnecessarily talking about) sex and gender in my own work. Not always feasible depending on topic and data, but always, always worth considering carefully. #ASHG18 (CC @fellgernon since related to previous discussion) https://t.co/edqepya3PH\n— Avery Davis Bell, PhD (@averydavisbell) October 19, 2018 Misc …","date":1539907200,"expirydate":-62135596800,"kind":"page","lang":"en","lastmod":1696363132,"objectID":"7896dc6f77d2f0008d4003249eb98f63","permalink":"https://lcolladotor.github.io/2018/10/19/ashg18-tweet-summary-day-4/","publishdate":"2018-10-19T00:00:00Z","relpermalink":"/2018/10/19/ashg18-tweet-summary-day-4/","section":"post","summary":"Continuing from my ASHG18 day 1 post, day 2, day 3 here’s my list of tweets from day 4.\n6F 11:00 am Cecilia Lingdren Got there at the end :P","tags":["ASHG"],"title":"ASHG18 tweet summary day 4","type":"post"},{"authors":null,"categories":["Conference"],"content":"Continuing from my ASHG18 day 1 post and day 2, here’s my list of tweets from day 3.\n9:15 20BC Jenna Carlson Jenna Carlson: creating population-specific reference panels for improved genotype imputation #ASHG18\n— Charleston Chiang (@CharlestonCWKC) October 18, 2018 .@jenccarlson Constructed a Samoan reference panel for imputation from 1,195 whole-genome sequenced Samoans as part of TOPMed. For MAF \u0026lt; 0.05, Ave R^2 0.696 with TOPMed ref panel, improves to 0.872 w Samoan-specific reference panel. #ASHG18\n— Daniel E. Weeks (@StatGenDan) October 18, 2018 Christopher R. Gignoux Next is Christopher Gignoux @popgenepi on the global landscape of pharmacogenomic variation as part of their work in the PAGE study #ASHG18\n— 23andMe Research \u0026amp; Therapeutics (@23andMeResearch) October 18, 2018 Christopher Gignoux: revised version of Population Architecture using Genomics and Epidemiology (PAGE) study now on @biorxivpreprint https://t.co/t1x4qeGSkB #ASHG18\n— Brooke LaFlamme (@Brooke_LaFlamme) October 18, 2018 CG: tested selection in pharmaco variants (haplotype length-based, corr with environment). Enviro-WAS takes geographic/climatic/ecological variables and cross with PAGE populations. #ASHG18\n— Charleston Chiang (@CharlestonCWKC) October 18, 2018 www.pagestudy.org\nCG (@popgenepi) describes our framework for conducting association analyses using phenotypes from NASA, World Wildlife Foundation, Berkeley Earth and GIDEON #ashg18\n— Elena Sorokin, PhD (@ElenaSorokin) October 18, 2018 Angela Andaleon “It’s my pleasure to introduce to you Dr Angela Andaleon” “Not a doctor yet!” “Aspiring doctor Angela Andaleon”\n^_^\nAngela is presenting the continuation of her undergrad project.\nAngela Andaleon: transcriptome-based association study in hispanic cohorts implicates novel genes in lipid traits. #ASHG18\n— Charleston Chiang (@CharlestonCWKC) October 18, 2018 AA: Replication cohorts: MESA HIS, GLGC. Ran gene-based association test in PrediXcan, using GTEx model and MESA model https://t.co/6wuD1fQB7l #ASHG18\n— 23andMe Research \u0026amp; Therapeutics (@23andMeResearch) October 18, 2018 6C 10 am Zongli Xu Now: Z. Xu: Blood DNA methylation profiles are altered years before breast cancer diagnosis: Findings from a case-cohort analysis in the Sister Study #ASHG18\n— Michael Hoffman @michaelhoffman.bsky.social (@michaelhoffman) October 18, 2018 Lang Wu Now: L. Wu: Genetically predicted methylation biomarkers and prostate cancer risk: A methylome-wide association study in over 140,000 European descendants #ASHG18 https://t.co/B4y1LUzB9m\n— Michael Hoffman @michaelhoffman.bsky.social (@michaelhoffman) October 18, 2018 LW: 1/Build CpG methylation prediction models with Framingham Heart Study data 2/Evaluate associations of genetically predicted methylation levels with prostate cancer risk using iCOGS-Oncoarray-GWAS meta results #ASHG18\n— Michael Hoffman @michaelhoffman.bsky.social (@michaelhoffman) October 18, 2018 Hmm, why use a 0.01 \\(R^2\\) cutoff? Isn’t that super low? Maybe I missed something.\nLW: 3/Significant associated CpG sites: assess correlations with expression of nearby genes in FHS. 4/Potential target genes: assess associations of genetically predicted mRNA expression with prostate cancer risk. #ASHG18\n— Michael Hoffman @michaelhoffman.bsky.social (@michaelhoffman) October 18, 2018 Moving to Hawaii to start his career as a PI. He had nice pictures to motivate others to join his lab ;)\n11 am 6A Hailiang Huang Missed it: got there for the questions.\nTarjinder Singh Tarjinder Singh\nLooking at rare variants using exome sequencing that explain schizophrenia risk. Genes with increased risk: TRIO (loss of function) and (missed it), GRIN2A (example of common and rare variant info being concordant). #ASHG18\n— 🇲🇽 Leonardo Collado-Torres (@lcolladotor) October 18, 2018 They built a browser for seeing the rare variants and the exome data. Not available yet.\nRujia Dai Rujia Dai\nCell types + schizophrenia disorder + bipolar disorder. Used psychENCODE data\nEstimated cell types in different brain regions. Identified cell type-specific co-expression modules. #ASHG18\n— 🇲🇽 Leonardo Collado-Torres (@lcolladotor) October 18, 2018 Rujia Dai\nOligodendrocyte, microglia, neuron upper cortex, neuron deeper cortex, astrocytes\nSCZD and BP are more related in the neurons from the upper cortex #ASHG18\n— 🇲🇽 Leonardo Collado-Torres (@lcolladotor) October 18, 2018 Ying Ji Used GTEx and BrainSpan data. Step 1. Identified risk genes using a method from an upcoming paper at Nature Genetics by Quan Wang, Rui Chen, et al. Step 2. Genome wide prediction: risk and background genes. #ASHG18\n— 🇲🇽 Leonardo Collado-Torres (@lcolladotor) October 18, 2018 Ying Li\nGpred and Bpred genes (GTEx and BrainSpan) enriched for SCZD gene lists. Small overlap between them. Used CommonMind Consortium SCZD DEGs list. Bpred tend to be upregulated in SCzD cases.#ASHG18\n— 🇲🇽 Leonardo Collado-Torres (@lcolladotor) October 18, 2018 Bpred and Gpred genes have different expression over development: they …","date":1539820800,"expirydate":-62135596800,"kind":"page","lang":"en","lastmod":1712869177,"objectID":"37fecd2773f9cf5e853e16c732935051","permalink":"https://lcolladotor.github.io/2018/10/18/ashg18-tweet-summary-day-3/","publishdate":"2018-10-18T00:00:00Z","relpermalink":"/2018/10/18/ashg18-tweet-summary-day-3/","section":"post","summary":"Continuing from my ASHG18 day 1 post and day 2, here’s my list of tweets from day 3.\n9:15 20BC Jenna Carlson Jenna Carlson: creating population-specific reference panels for improved genotype imputation #ASHG18","tags":["ASHG"],"title":"ASHG18 tweet summary day 3","type":"post"},{"authors":null,"categories":["Conference"],"content":"Continuing from my ASHG18 day 1 post, here’s my list of tweets from day 2. Note that I changed sessions a few times.\nI have to say, digitally attending #ASHG18 by frantically refreshing the hashtag feed in my living room is...not quite the same. But maybe I\u0026#39;ll get fish tacos for dinner.\n— Julie Nadel (@JulieNadel) October 17, 2018 Turn down the lights and turn up the AC for the fuller remote #ASHG18 experience! 🤪\n— Damien C-C (@dccc_phd) October 17, 2018 6E 10:30 am Live tweet our #ASHG18 session on #SilentGenomes to hear what #Indigenous scientists are doing to change the narrative and push for more #IndiGenomics moderated by @KeoluFox and @NanibaaGarrison on Wed at 10:30am PT https://t.co/zI8NPXotop\n— Nanibaa\u0026#39; Garrison (@NanibaaGarrison) October 16, 2018 Nanibaa’ Garrison Check Claw et al paper at @NatureComms from @SINGConsortium “A framework for enhancing ethical genomic research with Indigenous communities.” https://t.co/qBuDWGPIV4 #indigenomes #ASHG18\n— 🇲🇽 Leonardo Collado-Torres (@lcolladotor) October 17, 2018 Maile Taualii “Nobody wakes up thinking how can I harm indigenous populations!”\nMaile Taualii: no one goes into research with the intent of harming indigenous communities, so why does this happen? Publish or Perish causes people to rush, skip steps. Ignorance of issues (not an excuse). “For their own good” mentality #ASHG18 #SilentGenomes #IndiGenomics\n— Brooke LaFlamme (@Brooke_LaFlamme) October 17, 2018 Don\u0026#39;t get distracted by the sexiness of genetic science! (Maile Taualii) #silentgenomes #ASHG18 #indigenomics\n— Nanibaa\u0026#39; Garrison (@NanibaaGarrison) October 17, 2018 #ASHG18 #silentgenomes Maile directly addressing the \u0026#34;residue\u0026#34; of colonialism that is linked to culturally sustainable biomedical research today!\n— Dr./Prof. Keolu Fox (@KeoluFox) October 17, 2018 Taualii: take-home messages 1. There is no easy solution 2. Ignorance isn’t an excuse 3. Understand what is at risk Think about whether your work is going to benefit the generations to come #SilentGenomes #IndiGenomics #ASHG18\n— Brooke LaFlamme (@Brooke_LaFlamme) October 17, 2018 Nadine Caron Nadine Caron: addressing inequity in genomic diagnosis \u0026amp; research. #ASHG18\n— Charleston Chiang (@CharlestonCWKC) October 17, 2018 Nadine Caron: \u0026#34;It is known that those who have the greatest health disparities, will actually benefit the least from new technologies and research\u0026#34; #ashg18 #silentgenomes\n— John Hawks (@johnhawks) October 17, 2018 I think that Nadine Caron’s suggestions for First Nations and indigenous populations in Canada apply to other countries and underrepresented communities #IndiGenomics #silentgenome #ASHG18\nRight @paleogenomics? https://t.co/7m5eWNpC8r\n— 🇲🇽 Leonardo Collado-Torres (@lcolladotor) October 17, 2018 Agree!! That is an approach to follow with vulnerable communities. e.g. #Afromexicans, they are not only underrepresented but also have been sadly neglected for centuries.\n— paleogenomics (@paleogenomics) October 17, 2018 Nadine Caron - access to research is an important determinant of health. Such a critical issue for health equity issues across the world. #silentgenomes #ASHG18\n— Chris Gignoux (@popgenepi) October 17, 2018 Ngiare Brown N Brown: Ancestry is not the same as culture. Genetic information today is increasingly commercialized and is creating another layer in an already tangled web #silentgenomes at #ASHG18\n— Elena Sorokin, PhD (@ElenaSorokin) October 17, 2018 Dr. Ngiare Brown: “Some information cannot be individually owned.” Genomics research w/indigenous communities needs to involve to thinking beyond Western notions of consent. #SilentGenomes #ASHG18 #IndiGenomics\n— Riley Taitingfong, PhD (@riley_ilyse) October 17, 2018 We too (Australia Aborigines) are excited about the sexiness of genetic research. So how do we make sure it gets done right? (Ngiare Brown) #SilentGenomes #ASHG18\n— Nanibaa\u0026#39; Garrison (@NanibaaGarrison) October 17, 2018 Third time she mentioned “sexy research”. I thought that this term was frowned upon, maybe it’s not.\nMaui Hudson He made us laugh with his conflict of interest slide. No commercial interests. Just interest in indigenous genomics and helping others.\nI like how Hudson is framing the scientific contribution of New Zealand: The genomic resources of Māori people are a unique resource, partnering with the community to enable them to be part of the conversation is essential to good science. #ashg18 #silentgenomes\n— John Hawks (@johnhawks) October 17, 2018 Issue with open data. They want to control how the data is re-used. Like for imputation: what are they looking at? Is it something they agree?\nHudson is expressing, though not in so many words, a tension between the consultative approach, in which indigenous communities have a voice in how data are used, and what human geneticists have conceived as \u0026#34;open access\u0026#34; to genome data. #ashg18 #silentgenomes\n— John Hawks (@johnhawks) October 17, 2018 I am struck by questions from audience members at #silentgenomes panel. Geneticists who are …","date":1539734400,"expirydate":-62135596800,"kind":"page","lang":"en","lastmod":1689109377,"objectID":"21c9f5b4729a577defdbf2fd96dcdbaf","permalink":"https://lcolladotor.github.io/2018/10/17/ashg18-tweet-summary-day-2/","publishdate":"2018-10-17T00:00:00Z","relpermalink":"/2018/10/17/ashg18-tweet-summary-day-2/","section":"post","summary":"Continuing from my ASHG18 day 1 post, here’s my list of tweets from day 2. Note that I changed sessions a few times.\nI have to say, digitally attending #ASHG18 by frantically refreshing the hashtag feed in my living room is.","tags":["ASHG"],"title":"ASHG18 tweet summary day 2","type":"post"},{"authors":["Leonardo Collado-Torres"],"categories":null,"content":" ","date":1539726741,"expirydate":-62135596800,"kind":"page","lang":"en","lastmod":1683613619,"objectID":"2a80cf6529915d0b93448b7588f99a85","permalink":"https://lcolladotor.github.io/publication/poster2018ashg/","publishdate":"2018-10-16T16:52:21-05:00","relpermalink":"/publication/poster2018ashg/","section":"publication","summary":"Poster presented at ASHG2018, biodata18 and PSB2019","tags":["BrainSeq","Poster"],"title":"Regional heterogeneity in gene expression, regulation and coherence in hippocampus and dorsolateral prefrontal cortex across development and in schizophrenia","type":"publication"},{"authors":null,"categories":["Conference"],"content":"Today was the first day of the American Society of Human Genetics (ASHG) 2018 conference. The official hashtag for the conference is ASHG18 on Twitter. At first I was tweeting myself and checking both the top and the latest tweets. As the day progressed I started a Google Doc to take notes during talks. I was missing some details so I was relying on the latest tweets and copy-pasting the tweet links to my notes. At some point I told myself I should simply turn this collection of tweet links into a simple blog post. So here it is for day 1. You can consider it a curated list of the ASHG18 tweets. Although it’s incomplete because it only covers the talks I went to starting from the Presidential address.\nThe linked tweets are frequently from Eli Robertson1 and Michael Hoffmann2, but also from other Twitter users3.\nSo, without further ado, here we go:\nArrive in SD for @GeneticsSociety #ASHG18 Cab driver a Greek Orthodox Palestinian from Jerusalem\nTell him that I am here for genetics meeting\nAnd his 1st ?: \u0026#34;Is the ancestry stuff accurate?...@Ancestry test told me that I\u0026#39;m 27% Greek and I know I am more than that.\u0026#34;\n😳\n— Sek Kathiresan MD (@skathire) October 16, 2018 Award presentations JL: Population → clan → family → patient. #ASHG18\n— Michael Hoffman @michaelhoffman.bsky.social (@michaelhoffman) October 17, 2018 Sek also thanked all his mentees ^^.\n#ASHG18: @gabecasis presenting the Curt Stern award to @skathire: “...be like Sek: think big, be enthusiastic, and self-examine”.\n— Maria Chahrour (@MariaChahrour) October 17, 2018 Diversity Thanks to @GeneticsSociety for expanding the code of conduct for #ASHG18. Let\u0026#39;s make the meeting safe, productive, and fun! https://t.co/CLu84vonSD pic.twitter.com/lT4bycqHxG\n— Michael Hoffman @michaelhoffman.bsky.social (@michaelhoffman) October 14, 2018 On the way to #ASHG18 to learn, meet, and share! interested in knowing how latent artifacts affect reconstruction of coexpression networks? Come to my talk on Fri, Room 6C#womeninSTEM #scientistMom cc Claire Ruberman, .@jtleek @alexisjbattle @andrewejaffe @mike_schatz pic.twitter.com/n3VrclqHS3\n— Princy Parsana (@princyparsana) October 16, 2018 3.75% of attendees are Hispanic at #ASHG18 (hosted in San Diego this year)\nWould love to see more! I know @lcgunam is training a few dozen a year and @sacnas is helping thousands across science. Let’s keep improving!#diversity\n— 🇲🇽 Leonardo Collado-Torres (@lcolladotor) October 16, 2018 Mine is simple. I don’t know everything @GeneticsSociety does to promote #diversity, but it’d be great if they took a 👀 at @rstudio’s diversity scholarship. Membership fee can be too prohibitive for scientists outside the US (if they manage to cover ✈️) https://t.co/nmZY7UrQUf\n— 🇲🇽 Leonardo Collado-Torres (@lcolladotor) October 16, 2018 Sek @skathire starts his #ASHG18 Curt Stern award presentation by briefly mentioning his immigration to the US story and highlighting it all in one word:\n“possibility”\n👏🏽🙌🏽\n— 🇲🇽 Leonardo Collado-Torres (@lcolladotor) October 17, 2018 Mitchel Cole SNP crispr-cas9 perturbation study in blood cells.\n#ashg18 Mitchel Cole describing genomewide CRISPR KO screen using red blood cell trait GWAS hits from our 2016 Cell paper using @uk_biobank \u0026amp; INTERVAL data: https://t.co/Ir4gk2rZ88\n— Adam Butterworth (@aidanbutty) October 17, 2018 MC mentioned metaFDR for combining pvalues from 4 tests.\nPriyanka Nakka Uniparental disomy using 23andMe data. Seeking prevalence information in general population.\nPN: Open questions: 1/What is the prevalence of UPD in general population (not ascertained for disease)? 2/What are rates of maternal UPD, paternal UPD, and subtypes in general population? 3/What phenotypes are associated with UPD? #ASHG18\n— Michael Hoffman @michaelhoffman.bsky.social (@michaelhoffman) October 17, 2018 3 types that can be identified by 2 in silico methods.\nPN: Used @23andMeResearch data, 5M+ customers, 80% consented for research. Computationally detect 3 subtypes of UPD (heterodisomy, isodisomy, or partial isodisomy) based on IBD between parent-child and ROH analysis. #ASHG18\n— Charleston Chiang (@CharlestonCWKC) October 17, 2018 PN: In ~900k duos in the 23andMe database, find 199 individuals with UPD. Overall rate of 1/2000 - twice as common as previously thought \u0026amp; first estimate of UPD prevalence in general population #ASHG18\n— 23andMe Research \u0026amp; Therapeutics (@23andMeResearch) October 17, 2018 PN: Problem distinguishing between UPD and consanguinity in parents. Trained logistic regression classifiers for each chromosome and population separately #ASHG18\n— 23andMe Research \u0026amp; Therapeutics (@23andMeResearch) October 17, 2018 Mentioned PheWAS.\nPN: Don’t know if you can get single cell data from 23andMe customers.\nIf you\u0026#39;re interested in interning with us like Priyanka did, send me a DM! You can also check out the current job openings on our Research Team here: https://t.co/TlJVQjdjqT #ASHG18\n— 23andMe Research \u0026amp; Therapeutics (@23andMeResearch) October 17, 2018 If like the …","date":1539648000,"expirydate":-62135596800,"kind":"page","lang":"en","lastmod":1708978936,"objectID":"d3df62816694da0367afa7eba2e04f08","permalink":"https://lcolladotor.github.io/2018/10/16/ashg18-tweet-summary-day-1/","publishdate":"2018-10-16T00:00:00Z","relpermalink":"/2018/10/16/ashg18-tweet-summary-day-1/","section":"post","summary":"Today was the first day of the American Society of Human Genetics (ASHG) 2018 conference. The official hashtag for the conference is ASHG18 on Twitter. At first I was tweeting myself and checking both the top and the latest tweets.","tags":["ASHG"],"title":"ASHG18 tweet summary day 1","type":"post"},{"authors":null,"categories":["Science"],"content":"A few days ago a friend of mine told me that I was on the list of newly admitted SNI members. A few have asked me since why did I request to join it. So here’s my public reply.\nWoo! Ya soy \u0026#34;Investigador Nacional Nivel I\u0026#34; en el Sistema Nacional de Investigadores de CONACyT en México @Conacyt_MX 🎉💪🏾🇲🇽\nI\u0026#39;m a National Researcher lvl I in the Mexican National Researchers Registry ^_^ 🎆🎉https://t.co/hud7Z22WLY\nGracias @malacopa_genome por el aviso! pic.twitter.com/NWnf90KOF1\n— 🇲🇽 Leonardo Collado-Torres (@lcolladotor) September 26, 2018 SNI First let me tell you what SNI is. It stands for Sistema Nacional de Investigadores which translates to National Researchers Registry. It’s a way that the Mexican government created in 1984 to recognize high quality researchers and encourage them to continue to do great research, teach the next generation of researchers and promote innovation (Wikipedia). There are three types of members:\nCandidato a Investigador Nacional: Candidate to National Researcher Investigador Nacional: National Researchers with 3 levels (1, 2 and 3) Investigador Nacional Emérito: National Emeritus Researcher To become a member you have to submit documentation to CONACyT showing that you have made contributions to science, technology, culture and society through scientific or technological developments, training new students, popularizing or translating science and technology, among other criteria. Once you are a member, you have to keep submitting new documents every couple of years to stay a member or advance in the ranks.\nThe real reason behind joining SNI I’ve read a little bit that there are many critics of the SNI system. Most of the criticisms are based on how they decide what is a good contribution and how they judge applications. The reality is also that the process of sending the necessary documentation is cumbersome to say the least. The CONACyT website breaks often enough that it can be painful to use.\nSo why do people want to join the SNI and go through all this complicated process? The main reason (I think) why people want to join the SNI is because being a member comes with a financial supplement. It’s enough that I’ve heard that it can constitute about a third of your salary. You can find headlines such as how CONACyT’s support to researchers went from a priviledge to a salary. This financial supplement is given to those members that work 20 hours a week on Mexican institutions.\nGiven how important this boost in salary is, I can understand very well the frustrations that come with interacting with the CONACyT website: specially when the website goes down and you have to submit your application before a given deadline.\nSo why did I apply to join SNI? You can find on CONACyT’s website an interview on why it’s important to join SNI or go elsewhere to read a study on the motivations people have for joining SNI. But why did I apply to join SNI given that I’m outside Mexico and won’t be getting the financial supplement?\nMy main motivation was protection.\nLets say that I return to Mexico as a researcher at UNAM or another Mexican institution. Currently there is only 1 call for new SNI members per year. If I were to return today (September 2018), I would need to wait several months for the 2019 application cycle. Then I would need to wait several months for all applications to be evaluated and would probably start receiving the financial salary boost on January 2020. That is a lot of time to wait!\nFurthermore, right now I don’t need the salary boost. But if I were to return then it could be a significant portion of my salary. Having all this riding on a cumbersome application (I’d be afraid of making a silly mistake in the application) and on an external evaluation would be stressful.\nSo the stakes for me were low right now. Now that I’m a SNI member if I were to return to Mexico I could start receiving that financial boost much sooner. Thus I’m also protecting myself by keeping my options open to stay abroad (in the US for me) or return to Mexico. For example, I have a verbal agreement with my boss on the length of my current job, but technically I’m an employee at will and can be fired pretty easily.\nI also applied because I have several friends that were applying or recently applied and helped me a lot navigate the application process1. Also, you never know if the application process will change and become more complicated later on: though I hope that it will get easier!\nBut back to protection and security. My father has taught me that it’s our responsibility to cover our backs. Lets imagine that I have dependents. It would be irresponsible of me to miss out on the financial supplement because I didn’t send my documentation on time or because I forgot to send in the renewal documents: maybe it wouldn’t affect me, but it would affect them. Completing my application in time is under my control. What CONACyT cares about, their evaluation process, the clarity and reliability of their website are …","date":1538179200,"expirydate":-62135596800,"kind":"page","lang":"en","lastmod":1689109377,"objectID":"1cc5fd7b79c33f06119f68667d334e67","permalink":"https://lcolladotor.github.io/2018/09/29/why-i-applied-to-join-sni-the-mexican-national-researchers-registry/","publishdate":"2018-09-29T00:00:00Z","relpermalink":"/2018/09/29/why-i-applied-to-join-sni-the-mexican-national-researchers-registry/","section":"post","summary":"A few days ago a friend of mine told me that I was on the list of newly admitted SNI members. A few have asked me since why did I request to join it.","tags":["Academia","Science","Leader"],"title":"Why I applied to join SNI: the Mexican National Researchers registry","type":"post"},{"authors":null,"categories":["Misc"],"content":"Today, September 19th 2018, Dan Rodricks (Twitter: DanRodricks) published an article in the Baltimore Sun. The article was shared to me with the title I only thought this happened to Mexicans^[I saw the article as a photo that was shared by Hopkins colleagues. Dan Rodrick’s Facebook page also shows the article with the original title.] and is currently titled^[As of 09/19/2018 at 10 pm ET.] as “Rodricks: Hopkins library specialist hit by immigration crackdown after being blindsided by visa denial”.\n{width=600px}\nI didn’t like the title at all nor did I feel right when reading the article. I shared it with about 50 other Mexicans in Baltimore^[Many of us are students, alumni or even staff members at Hopkins and affiliated institutes (like myself).], talked about it over dinner, discussed a bit with Hopkins colleagues, and now thanks to all of them I have a clearer idea of what my problems with this article are. And there are many of them, but we can group them into:\nthe reporting by Dan Rodricks, the portrayed handling of Dr. Mahoney-Steel’s case by Johns Hopkins University, and the portrayed lack of attention by Dr. Mahoney-Steel. Before I get into all of it, there is a petition online in support of Dr. Mahoney-Steel that you can read and sign here if you want: nearly 2,000 people have already signed it. You can also read other’s reasons for signing the petition. Right now I do not feel comfortable signing this petition, but maybe you are.\nThe reporting by Dan Rodricks The article starts by framing Dr. Mahoney-Steel’s story around the fact that she had to return to England due to issues with her immigration paperwork and that:\nthe reaction of several friends and colleagues was uncannily the same: “I thought this only happened to Mexicans.”\nThere was no need at all to grab attention to Dr. Mahoney-Steel’s story by mentioning Mexicans or any other Spanish-speaking immigrants. Dan Rodricks is trying to get the reader to think that Mexicans are illegal immigrants (which many politicians have said), and thus that they aren’t welcome, and then ohh, others aren’t welcome either. Another interpretation of this quote is that Mexicans are uneducated, which would be equally offending.\nWhile I’m glad that the title has been changed at the Baltimore Sun’s website, the first paragraph and last paragraph of the story still mention this quote that is attributed to friends and colleagues of Dr. Mahoney-Steel. They might have said this, but Dan Rodricks could have simply ignored their quote and framed his story along the lines of the updated title: a library specialist that is suffering because of the current immigration policies.\nMy second problem with the reporting is that there is a lack of information that is important in this context. There are many ways to become a permanent resident in the US and thus get a green card. Some of these ways involve getting sponsored by your employer. Some don’t. Basically, in some situations it would be the employer’s responsibility (Johns Hopkins University in this case) to be involved in and be supportive and in others I think that they are not obliged to help financially. You can have very different reactions to this story based on what mechanism Dr. Mahoney-Steel was asking Johns Hopkins University to help her.\nThe portrayed handling of Dr. Mahoney-Steel’s case by Hopkins I’m using portrayed here because we currently don’t know Hopkins’ side.\nWhat seems to be the main reason why Dr. Mahoney-Steel’s case became a story is because she submitted her documents to request a renewal of her H-1B (highly specialized worker) visa to Johns Hopkins University’s Office of International Services. She didn’t hear back from them until she heard in August 21st that they decided not to send her documents to the US government and that she should leave the country by August 31st.\nThis is hugely disturbing and would be enough to grab the attention of many readers. This is what caught the attention of several colleagues at Hopkins. We haven’t really heard the story from OIS’ perspective and I would definitely want to know more^[If they ever can share their story due to privacy restrictions.].\nDue to the lack of details in the article, we don’t know exactly which mechanism Dr. Mahoney-Steel was asking Hopkins to help her with. She might have been considering applying under employed-based immigration via EB-1 or EB-2. For the EB-1 I think that your employer has to help you quite a bit. But not all employers want to do so. Also these processes take a considerable amount of time, not 10 days.\nAlternatively, maybe Dr. Mahoney-Steel was asking Hopkins to help her pay for her green card application through family since she’s married to a US citizen and due to their portrayed extremely poor communication on her H-1B visa …","date":1537315200,"expirydate":-62135596800,"kind":"page","lang":"en","lastmod":1689109377,"objectID":"488aef652f262b778327d18428549321","permalink":"https://lcolladotor.github.io/2018/09/19/problems-with-an-article-from-the-baltimore-sun-covering-dr-mahoney-steel-s-immigration-issues/","publishdate":"2018-09-19T00:00:00Z","relpermalink":"/2018/09/19/problems-with-an-article-from-the-baltimore-sun-covering-dr-mahoney-steel-s-immigration-issues/","section":"post","summary":"Today, September 19th 2018, Dan Rodricks (Twitter: DanRodricks) published an article in the Baltimore Sun. The article was shared to me with the title I only thought this happened to Mexicans^[I saw the article as a photo that was shared by Hopkins colleagues.","tags":["Academia","politics","immigration"],"title":"Problems with an article from the Baltimore Sun covering Dr. Mahoney-Steel’s immigration issues","type":"post"},{"authors":null,"categories":["Ideas"],"content":"Today I attended the special panel discussion event at JHSPH called “Separated: Children Separation at the Border A Health and Human Rights Perspective”. It got my mind racing and here’s an idea. It’s likely (definitely) incomplete, but maybe it’ll get others to think on related ideas.\n[Image source](http://hopkinshumanitarianhealth.org/news-events/events/separated-child-separation-at-the-border-a-health-and-human-rights-perspect) Panel summary The panel was composed by:\nColleen Kraft, President, American Academy of Pediatrics Eric Schwartz, President, Refugee International George Escobar, Chief of Program and Services, CASA de Maryland Paul Spiegel, Director, Center for Humanitarian Health I missed the first 30 minutes or so but I still got to listen to most of it. The panel members presented many facts and here are some that will be relevant to the idea I have:\nChild separation is just one of the consequences of the current’s administration immigration policies implemented and enforced by the Department of Justice (ultimately headed by Jeff Sessions, the US Attorney General). The US is the only country (to the panel’s members knowledge) with a child separation policy. Due to empathy many individuals across political lines reacted against child separation. The US immigration system won’t really change much even if Democrats get elected. Obama did deport over 2 million individuals, though he prioritized criminals1. Arrested immigrants are not required by law to have representation (a lawyer) provided by the government2. Minors (say 3 year old children) with no lawyers are being highlighted in the media. Immigration cases where the defendants have lawyers drastically improve3 the odds for the defendants. Immigration judges are human. Immigration judges typically used to (or maybe still do) try to give time for a minor to get a lawyer. Immigration judges are alledgely4 being pressured to meet quotas in the range of 700 to 1,000 cases by year under the current administration. Thus judges sometimes have to close cases in a couple of hours. Immigration judges now basically have 2 options for closing a case: order deportation or (I’m missing the correct term) free the defendant. At the end the panel members highlighted that we should take some type of action5 but that we should consider the consequences of our suggested policy changes. They also mentioned that we should take advantage of this moment (child separation got everyone’s attention) to raise the profile of the other problems with the current immigration policies.\nMy way of taking action: here’s an idea I’m by no means an immigration expert. My way of taking action is to share ideas, like I’ve done in the past, that might be incomplete, unrealistic or even super flawed, but that hopefully motivate others.\nThe bare bones version of my idea was: what if immigrants could have an automatic (programmed) lawyer and translator during their hearings? This would not be a replacement for actually having lawyers (say those provided by local governments or NGOs as George Escobar mentioned) but would raise the minimum bar for those immigrants who currently have their cases processed with no lawyers at all.\nGetting into the details Imagine that we could get our hands on dozens/hundreds/thousands? of transcripts of immigration court hearings where we have the following information:\nwhat the judge said what the government’s lawyer said what the defendant’s lawyer said (either to the judge or to the defendant) what the defendant said Just like a script for a play. We would additionally need a table with court hearing metadata such as:\nOutcome: deportation, being freed (term?). Date of the hearing. State where the hearing occurred. Then using machine learning (maybe with deep learning methods) process the text and try to determine potential suggestions an actual defendant’s lawyer would give to its defendant or respond to the judge/government’s lawyer. It might not always get things right, but I imagine that it would be better than the current state of affairs.\nThe automatic lawyer would need then to work as say a phone app that listens to what others are saying in the room. Say have 3 icons with one per person present (judge, defendant, gov’s lawyer). Then the defendant presses each button when each person is talking. The app then shows some 1 to say 3 suggested responses (with translations)6 and responds for the defendant in English once the defendant chooses an option (or goes with the top one).\nImplementing an initial version of the app I think that large computing companies like Amazon, Microsoft and Google would be willing to provide some compute credits on their clouds for the initial version of the algorithm that is listening to the court hearing and then provides suggestions. Think of this as the “suggested text” you get nowadays when typing emails on Gmail or text messages. Maybe these companies have programs where you can apply to have some of their engineers …","date":1537142400,"expirydate":-62135596800,"kind":"page","lang":"en","lastmod":1689109377,"objectID":"af258cdd6166562d863f3cd60b9afe16","permalink":"https://lcolladotor.github.io/2018/09/17/what-about-a-lawyer-like-app-as-the-mininum-help-for-defandants-in-immigration-cases/","publishdate":"2018-09-17T00:00:00Z","relpermalink":"/2018/09/17/what-about-a-lawyer-like-app-as-the-mininum-help-for-defandants-in-immigration-cases/","section":"post","summary":"Today I attended the special panel discussion event at JHSPH called “Separated: Children Separation at the Border A Health and Human Rights Perspective”. It got my mind racing and here’s an idea.","tags":["politics","Prediction","Diversity"],"title":"What about a lawyer-like app as the minimum help for defendants in immigration cases?","type":"post"},{"authors":null,"categories":["rstats","UNAM"],"content":" This blog post was written by ME Martinez-Sanchez, S Muñoz, M Carrillo, E Azpeitia, D Rosenblueth and originally posted at the CDSB blog.1\nIn this blog post we will describe the package rGriffin (Martinez-Sanchez, Muñoz, Carrillo, Azpeitia, et al., 2019) that was one of the projects developed during the TIB2018-BCDW. We hope to continue developing Griffin and rGriffin (Martinez-Sanchez, Muñoz, Carrillo, Azpeitia, et al., 2019). If you have ideas, suggestions or bugs, please contact us via rGriffin GitHub repo.\nThe problem Boolean networks allow us to give a mechanistic explanation to how cell types emerge from regulatory networks. However, inferring the regulatory network and its functions is complex problem, as the available information is often incomplete. rGriffin (Martinez-Sanchez, Muñoz, Carrillo, Azpeitia, et al., 2019) uses available biological information (regulatory interactions, cell types, mutants) codified as a set of restrictions and returns the Boolean Networks that satisfy that restrictions. This Boolean networks can then be used to study the biological system.\nThe rGriffin (Martinez-Sanchez, Muñoz, Carrillo, Azpeitia, et al., 2019) package is an R connector to Griffin (Gene Regulatory Interaction Formulator For Inquiring Networks), a java library for inference and analysis of Boolean Network models. Griffin takes as inputs biologically meaningful constraints and turns them into a symbolic representation. Using a SAT engine, Griffin explores the Boolean Network search space, finding all satisfying assignments that are compatible with the specified constraints. The rGriffin (Martinez-Sanchez, Muñoz, Carrillo, Azpeitia, et al., 2019) package includes a number of functions to interact with the BoolNet package.\nA small example Let us suppose a cell, we know that this cell has three proteins called a, b and c. We know that a activates b and that b and c inhibit each other. We also suspect that b and c may have positive self-regulatory loops. We can add this interactions to the table as “OPU” (optional, positive, unambiguous). This dataframe is the topology of the network.\nSource Target Interaction a b + b c - c b - b b OPU c c OPU Suppose we also have some information of what cell types have been observed. For example, there is a cell type that expresses b, but not a or c and an other cell type that expresses c, but not a or b. There might exist a third cell type that has not been fully characterized where we know that the cell expresses no a or c but we have NO information on b. This dataframe is the attractors of the network.\na b c 0 1 0 0 0 1 0 * 0 We can then use this information to create a query. rGriffin (Martinez-Sanchez, Muñoz, Carrillo, Azpeitia, et al., 2019) can include other types of information like transition between cell type, cycles, transitions between cell types or mutant cell types.\n## Install using: # devtools::install_github(\u0026#39;mar-esther23/rgriffin\u0026#39;) ## Note that the package depends on rJava library(\u0026#39;rGriffin\u0026#39;) ## Loading required package: rJava genes = c(\u0026#39;a\u0026#39;,\u0026#39;b\u0026#39;,\u0026#39;c\u0026#39;) inter = data.frame(source=c(\u0026#39;a\u0026#39;,\u0026#39;b\u0026#39;,\u0026#39;c\u0026#39;, \u0026#39;b\u0026#39;,\u0026#39;c\u0026#39;), target=c(\u0026#39;b\u0026#39;, \u0026#39;c\u0026#39;, \u0026#39;b\u0026#39;, \u0026#39;b\u0026#39;, \u0026#39;c\u0026#39;), type=c(\u0026#39;+\u0026#39;,\u0026#39;-\u0026#39;,\u0026#39;-\u0026#39;,\u0026#39;OPU\u0026#39;,\u0026#39;OPU\u0026#39;), stringsAsFactors = F ) q = create.gquery.graph(inter, genes) attr = data.frame(a=c(0,\u0026#39;*\u0026#39;,0), b=c(0,1,0), c=c(0,0,1), stringsAsFactors = F ) q = add.gquery.attractors(q, attr) Then we can use Griffin to find the networks that behave according with our biological information.\nnets = run.gquery(q) nets ## [1] \u0026#34;targets,factors\\na,false\\nb,((((!a\u0026amp;b)\u0026amp;!c)|((a\u0026amp;!b)\u0026amp;!c))|((a\u0026amp;b)\u0026amp;!c))\\nc,(!b\u0026amp;c)\\n\u0026#34; ## [2] \u0026#34;targets,factors\\na,false\\nb,(((((!a\u0026amp;b)\u0026amp;!c)|((a\u0026amp;!b)\u0026amp;!c))|((a\u0026amp;b)\u0026amp;!c))|((a\u0026amp;b)\u0026amp;c))\\nc,(!b\u0026amp;c)\\n\u0026#34; ## [3] \u0026#34;targets,factors\\na,false\\nb,((((((!a\u0026amp;b)\u0026amp;!c)|((!a\u0026amp;b)\u0026amp;c))|((a\u0026amp;!b)\u0026amp;!c))|((a\u0026amp;b)\u0026amp;!c))|((a\u0026amp;b)\u0026amp;c))\\nc,(!b\u0026amp;c)\\n\u0026#34; ## [4] \u0026#34;targets,factors\\na,false\\nb,((((!a\u0026amp;b)\u0026amp;!c)|((a\u0026amp;b)\u0026amp;!c))|((a\u0026amp;b)\u0026amp;c))\\nc,(!b\u0026amp;c)\\n\u0026#34; ## [5] \u0026#34;targets,factors\\na,false\\nb,((((((!a\u0026amp;b)\u0026amp;!c)|((a\u0026amp;!b)\u0026amp;!c))|((a\u0026amp;!b)\u0026amp;c))|((a\u0026amp;b)\u0026amp;!c))|((a\u0026amp;b)\u0026amp;c))\\nc,(!b\u0026amp;c)\\n\u0026#34; There are multiple options to integrate BoolNet and rGriffin (Martinez-Sanchez, Muñoz, Carrillo, Azpeitia, et al., 2019). The function get.net.topology() can obtain the topology with interaction signs of a BoolNet network. The function attractor2dataframe() can be used to export a BoolNet attractor as a dataframe that rGriffin (Martinez-Sanchez, Muñoz, Carrillo, Azpeitia, et al., 2019) can use. The function run.gquery() includes the option return=’BoolNet’, that return the inferred networks as BoolNet networks.\nHistory The development of Griffin began in 2013 as a PAPIIT (Programa de Apoyo a Proyectos de Investigación e Innovación Tecnológica) project to solve the inference of Boolean Network models for the Arabidopsis thaliana root stem cell niche. It continued in 2015 with support of Conacyt grant 221341.\nIn January, 2017 we organized a course in C3-UNAM to teach biologist how to use Griffin. We received two main comments: the input format was too complicated and it was uncomfortable to use the output with …","date":1536796800,"expirydate":-62135596800,"kind":"page","lang":"en","lastmod":1651386771,"objectID":"785b0d7a1e02c7081efa883e35f29958","permalink":"https://lcolladotor.github.io/2018/09/13/r-gene-regulatory-interaction-formulator-for-inquiring-networks/","publishdate":"2018-09-13T00:00:00Z","relpermalink":"/2018/09/13/r-gene-regulatory-interaction-formulator-for-inquiring-networks/","section":"post","summary":"This blog post was written by ME Martinez-Sanchez, S Muñoz, M Carrillo, E Azpeitia, D Rosenblueth and originally posted at the CDSB blog.1\nIn this blog post we will describe the package rGriffin (Martinez-Sanchez, Muñoz, Carrillo, Azpeitia, et al.","tags":["rstats","Bioconductor","CDSB"],"title":"R Gene Regulatory Interaction Formulator For Inquiring Networks","type":"post"},{"authors":["Semick SA","Leonardo Collado-Torres","Markunas CA","Shin JH","Deep-Soboslay A","Tao R","Huestis MA","Bierut LJ","Maher BS","Johnson EO","Hyde TM","Weinberger DR","Hancock DB","Kleinman JE \u0026dagger;","Jaffe AE \u0026dagger;"],"categories":null,"content":" With BrainSeq Phase I data https://t.co/CN8QO1xGlV you can, among many things, subset it \u0026amp; study the \u0026#34;Developmental effects of maternal smoking during pregnancy on the human frontal cortex transcriptome\u0026#34; as @SteveSemick @andrewejaffe @LieberInstitute did https://t.co/Hl60FChJgV pic.twitter.com/jbaM9McXAs\n— 🇲🇽 Leonardo Collado-Torres (@lcolladotor) August 21, 2018 ","date":1534809600,"expirydate":-62135596800,"kind":"page","lang":"en","lastmod":1651425968,"objectID":"9970a8f199a5c01759837801e50f41d6","permalink":"https://lcolladotor.github.io/publication/2018-08_maternalsmoking/","publishdate":"2018-08-21T00:00:00Z","relpermalink":"/publication/2018-08_maternalsmoking/","section":"publication","summary":"This paper is on smoking and its relation to gene expression at different life stages. These genes are also related to autism spectrum disorder.","tags":["BrainSeq"],"title":"Developmental effects of maternal smoking during pregnancy on the human frontal cortex transcriptome","type":"publication"},{"authors":["Leonardo Collado-Torres"],"categories":null,"content":" ","date":1532944800,"expirydate":-62135596800,"kind":"page","lang":"en","lastmod":1621020950,"objectID":"161b12e6bb2e120dca7dd79110335c97","permalink":"https://lcolladotor.github.io/talk/cdsb2018/","publishdate":"2018-07-30T10:00:00Z","relpermalink":"/talk/cdsb2018/","section":"talk","summary":"Keynote to kickoff the CDSB Mexico 2018 R/Bioconductor workshop","tags":["CDSB","recount2","derfinder","recount brain","LCG"],"title":"From learning to using to teaching to developing R","type":"talk"},{"authors":null,"categories":["Science"],"content":"Today was a big day. I care about many things including diversity in science (STEM) and building a community of R users and developers in Mexico. Both moved forward in two completely separate conferences: one in Mexico: CDSBMexico; and one in Canada: JSM2018.\nCDSBMexico This was a very important day for me. It was the beginning of the Latin American R/BioConductor Developers Workshop 2018 in Cuernavaca, Mexico. I already wrote a blog post about why I was super excited about CDSBMexico, but briefly it’s because this is something we’ve been wanting to see become a reality for years and have been working towards it.\nHere are my slides for my #CDSBMexico remote talk tomorrow for day 1 of the \u0026#34;Latin American R/BioConductor Developers Workshop 2018\u0026#34;. 70 slides for ~20 min, I can do this! 💪🏾 Right @jtleek @Shannon_E_Ellis?https://t.co/xKh2214YbM#rstats #teaching @Bioconductor @CDSBMexico pic.twitter.com/SULAoPbHeZ\n— 🇲🇽 Leonardo Collado-Torres (@lcolladotor) July 29, 2018 My job was to give the first keynote to pump up everyone at the workshop. So I had a bit of trouble sleeping and woke up remembering a dream. If you know me, I never dream: or never remember my dreams. It was a dream of my grandmother Mercedes Vides Tovar.\nGrandma I have many things from my grandparents in me, like Juan’s joviality, Rosa’s love, Rolando’s tenacity to overcome tough moments. Or so I like to think. But my grandma, Abue, has always been an academic inspiration. She overcame many challenges in her life. She studied at the university to become a doctor, even without total family support (to avoid details). She was a trailblazer in the field of Epidemiology. She had to flee her native country leaving everything behind. She studied at the Institut Pasteur in Paris, France while caring for 3 adolescents as a single mom. She studied in a time when WomenInSTEM had to disguise themselves up as men and were the targets of jokes all the time. Rolando, her classmate at the university, has told me a handful of these jokes: I wouldn’t be the only one to call many of them harassment. She left academia to start her own business in public health. She was the main health supervisor in the first international conference my dad organized early in his career (which helped him launch it): I was the 6 year old in charge of delivering the gifts in the closing ceremony ^^. She would answer my phone calls when I first started French school and my dad was busy at work: thanks to their time in Paris my dad fell in love with the French way of teaching math.\nI actually don’t know much more. She passed away when I was 13 after a years long battle with disease. Google tells me that she is a co-author of at least three titles in the field of Public Health:\n1968 Organización del servicio social de los pasantes de Odontología en México 1970 Situación epidemiológica de la frontera norte de México y programa de vigilancia 1972 Proyecto de organización y funcionamiento de los laboratorios de salud pública en los estados de la frontera norte: also, she’s the sole author. I did inherit her souvenirs from her trips (my dad also loves them) and something that is precious to me: a medal with her name. I’ve looked at that medal next to my bed in Mexico many times. I would look at it, search for inspiration, then try harder to solve whatever academic problem I had.\nIn my dream there was a moment where I was sitting next to her (me in my current adult form) and we were revising many of our shared moments. She was explaining to me things she couldn’t explain before because I wouldn’t have understood them. She also pumped me up before my day and wished me luck for my talk. I think that I delivered ^^\n@CDSBMexico @fellgernon dio una charla inspiradora \u0026lt;3 #collaboration #rstats #TIBs2018 @nnb_unam\n— Semiramis (@semiramis_cj) July 30, 2018 WomenInStem Today was a big day for WomenInSTEM and in particular in the field of Statistics. Why? Today the Joint Statistical Meetings (JSM2018) held a session on “Addressing Sexual Misconduct in Statistics” that was organized by Stephanie Hicks and chaired by Keegan Korthauer.\nFor #JSM2018, I organized a session on Addressing Sexual Misconduct in Statistics. If you plan to attend the meeting, I invite you to join us https://t.co/UxpUiqPzTy pic.twitter.com/IdShEPlqi6\n— Stephanie Hicks (@stephaniehicks.bsky.social) (@stephaniehicks) June 6, 2018 The session is not a direct response (I think) but it’s definitely related to Kristian Lum’s blog post titled Statistics, we have a problem and to the more general MeToo movement.\nSexual harassment and misconduct not a US problem only. We have a code of conduct at CDSBMexico both in English and Spanish to help prevent any issues.\nQ by me: what to do when people outside the U.S. say that this is an American problem and they don\u0026#39;t need to have a code of conduct for their meeting? #JSM2018\n— Michael Hoffman @michaelhoffman.bsky.social (@michaelhoffman) July 30, 2018 I couldn’t be there, but I wasn’t the only …","date":1532908800,"expirydate":-62135596800,"kind":"page","lang":"en","lastmod":1689109377,"objectID":"02d68f2d7ceedfc593f6198d6f56b258","permalink":"https://lcolladotor.github.io/2018/07/30/harassment-diversity-in-science-and-inspiration-from-my-grandmother/","publishdate":"2018-07-30T00:00:00Z","relpermalink":"/2018/07/30/harassment-diversity-in-science-and-inspiration-from-my-grandmother/","section":"post","summary":"Today was a big day. I care about many things including diversity in science (STEM) and building a community of R users and developers in Mexico. Both moved forward in two completely separate conferences: one in Mexico: CDSBMexico; and one in Canada: JSM2018.","tags":["Diversity","Academia","work-life"],"title":"Harassment, diversity in science and inspiration from my grandmother","type":"post"},{"authors":["Jaffe AE","Straub R","Shin JH","Tao R","Gao Y","Leonardo Collado-Torres","Kam-Thong T","Xi HS","Quan J","Chen Q","Colantuoni C","Ulrich WS","Maher BJ","Deep-Soboslay A","The BrainSeq Consortium","Cross AJ","Brandon NJ","Leek JT","Hyde TM","Kleinman JE","Weinberger DR"],"categories":null,"content":" Check out our most recent @LieberInstitute work on eQTLs, DLPFC development and #schizophrenia at https://t.co/CN8QO1xGlV lead by @andrewejaffe. Thanks to @biorxivpreprint for letting us share our progress https://t.co/6Zds7FW4U7 and @NatureNeuro for publishing the final version! pic.twitter.com/CKJxoXmAdu\n— 🇲🇽 Leonardo Collado-Torres (@lcolladotor) July 26, 2018 Most comprehensive eQTL resource in human brain to date, finds half of risk snps for schizophrenia map to nearby expression, including unannotated sequence https://t.co/Q4TGxChb66 @LieberInstitute check out browser at https://t.co/PdoshZZE5J\n— Andrew Jaffe (@andrewejaffe) July 26, 2018 ","date":1532563200,"expirydate":-62135596800,"kind":"page","lang":"en","lastmod":1651425968,"objectID":"6f7bb196378082f22a23c43d48adb717","permalink":"https://lcolladotor.github.io/publication/2018-07_bsp1/","publishdate":"2018-07-26T00:00:00Z","relpermalink":"/publication/2018-07_bsp1/","section":"publication","summary":"Genome-wide association studies have identified 108 schizophrenia risk loci, but biological mechanisms for individual loci are largely unknown. Using developmental, genetic and illness-based RNA sequencing expression analysis in human brain, we characterized the human brain transcriptome around these loci and found enrichment for developmentally regulated genes with novel examples of shifting isoform usage across pre- and postnatal life. We found widespread expression quantitative trait loci (eQTLs), including many with transcript specificity and previously unannotated sequence that were independently replicated. We leveraged this general eQTL database to show that 48.1% of risk variants for schizophrenia associate with nearby expression. We lastly found 237 genes significantly differentially expressed between patients and controls, which replicated in an independent dataset, implicated synaptic processes, and were strongly regulated in early development. These findings together offer genetics- and diagnosis-related targets for better modeling of schizophrenia risk. This resource is publicly available at http://eqtl.brainseq.org/phase1.","tags":["BrainSeq","derfinder"],"title":"Developmental and genetic regulation of the human cortex transcriptome illuminate schizophrenia pathogenesis","type":"publication"},{"authors":null,"categories":["Science"],"content":" I have recently been getting reminder emails from the Science \u0026amp; SciLifeLab Prize for Young Scientists. The application deadline is July 15th, 2018!\nLast year I submitted an entry to this competition and I enjoyed the experience, even if it was a bit rushed. The process of joining the competition is relatively straight forward:\nWrite an essay about your Ph.D. thesis work. Get a recommendation letter from your Ph.D. advisor. Write a short Ph.D. thesis abstract section, list your affiliation, education, academic and professional awards and professional experience. Include references. You don’t need to pay for competing! You already did the very hard part of completing your Ph.D.!!! I also like competitions like this one that invite you to think about your thesis and how to explain it. You should note that you are only eligible to participate once in this competition.\nYou can read about the 4 winners from 2017 at www.sciencemag.org/prizes/SciLifeLab/2017 and other years too to draw some inspiration from. I didn’t win, but I’m still going to share my entry in case it’s useful to others. I’m also sharing it to keep with the theme of also sharing your failures that I talked in my mindfulness post.\nI don’t know exactly why my entry was not selected (you might have some ideas on how to improve it!). But I can tell you that:\nI knew the deadline was coming but I wrote it the week it was due. I didn’t have time to ask for some more specific feedback from others. I forgot that a recommendation letter was needed, so I asked at the very last minute for one by Jeff Leek. I don’t know what magic he did (likely skipping a few hours of sleep, sorry!!!) but he managed to send it in time. Oops! I’m not sure if I should have emphasized more the impact of my Ph.D. thesis work or what else to do. However, I do know that this exercise was useful. First, just re-reading my essay makes me smile. Also, Figure 1 shown here became a figure in the recount-workflow paper (Collado-Torres, Nellore, and Jaffe, 2017). Furthermore, when I was notified about the Thinkable Bioinformatics Peer Prize III I didn’t have to think twice about joining that competition. Finally, since I wrote it in an Rmd file, it was easy to modify for this blog post.\nLike I’ve said, you have nothing to lose by joining this competition. Yes, you have to invest a bit of time. But it can be helpful and morale boosting! Plus, you have a chance to win it!!! Just remember that the deadline is July 15th, 2018 (and to give your advisor enough time to write their recommendation letter for you)!\nIn case you are curious, here are my full entry files (the figure is here though).\n\\[1\\] L. Collado-Torres, A. Nellore, and A. E. Jaffe. “recount workflow: Accessing over 70,000 human RNA-seq samples with Bioconductor \\[version 1; referees: 1 approved, 2 approved with reservations\\]”. In: F1000Research (2017). DOI: 10.12688/f1000research.12223.1. URL: https://f1000research.com/articles/6-1558/v1. Without further ado, here’s my full entry:\nUsable human gene expression data and annotation-agnostic methods In the last decade RNA sequencing (RNA-seq) has become the predominant assay for measuring gene expression. RNA-seq allows us to measure all expressed genes, improve gene and transcript annotation, and measure expressed sequences that otherwise are excluded in microarray studies. Typical RNA-seq analysis starts with a matrix containing the number of RNA-seq reads overlapping each gene for each sample (Michael I. Love et al. 2016; Law et al. 2016). To compute such a matrix, you first map the raw data to the genome with aligners such as TopHat2 and HISAT (Kim et al. 2013; Kim, Langmead, and Salzberg 2015) and then use tools such as Rsubread and HTSeq (Y, GK, and W 2013; Anders, Pyl, and Huber 2014) to construct the read count matrix. After measuring enough samples, you can determine which genes are differentially expressed between two or more groups.\nWhen I started my graduate studies with Jeff Leek, the most commonly used methods for differential expression analysis were DESeq (Anders and Huber 2010) and edgeR (Robinson, McCarthy, and Smyth 2010). Leek and colleagues put together a set of gene count matrices in a project called ReCount (Alyssa C. Frazee, Langmead, and Leek 2011). ReCount allowed researchers to access several datasets without having to run the whole processing pipeline. ReCount then helped the development of new methods such as DESeq2 (Michael I. Love, Huber, and Anders 2014). It was also Leek and colleagues that decided to look at RNA-seq data in a manner less dependent on potentially incomplete gene annotation. With the increase in size of RNA-seq projects, they thought it would be feasible to assess the differential expression signal at base pair resolution in an approach called differentially expressed regions (DER) finder (Alyssa C. Frazee et al. 2014).\nIt was around then that I started to work with Andrew Jaffe, who had RNA-seq data from the human brain. Jaffe and …","date":1529452800,"expirydate":-62135596800,"kind":"page","lang":"en","lastmod":1689109377,"objectID":"5eec36616814ef61f33abed71a38731c","permalink":"https://lcolladotor.github.io/2018/06/20/scilifelab-prize-you-still-have-time-to-participate/","publishdate":"2018-06-20T00:00:00Z","relpermalink":"/2018/06/20/scilifelab-prize-you-still-have-time-to-participate/","section":"post","summary":"I have recently been getting reminder emails from the Science \u0026 SciLifeLab Prize for Young Scientists. The application deadline is July 15th, 2018!\nLast year I submitted an entry to this competition and I enjoyed the experience, even if it was a bit rushed.","tags":["Academia","Genomics","Science","Research"],"title":"SciLifeLab Prize: you still have time to participate! ","type":"post"},{"authors":null,"categories":["Misc"],"content":"This is a joint blog post between Stephanie Hicks and Leonardo Collado-Torres. We want to share with you our experience using Slack and why you should join us. This post is in an interview style.\n{width=400px}\nWhat is Slack? [SH] Slack is a communication tool for teams. The main idea is you have individual chat rooms (referred to as channels that always begin with the # symbol), which are organized by topics. Traditionally, if an email is sent to everyone on your team, each person must decide how tag or organize emails in their account. In contrast, Slack provides the structure and organization for all users on the team. Each user clicks on a specific topic, or channel, and all the messages related to that topic are already there, thereby reducing the organizational burden. In a slack team used by academic department, topics can be anything from announcements of #conferences, #workshops, #jobs, #seminars, #working_groups, #good_reads, #food_callouts, #payroll, and #IT_help. You can write public messages in the individual channels or send private direct messages to anyone on your team. Everything in Slack is searchable (e.g. files, conversations, people). Finally, Slack includes a lot of functionality and integration with other useful tools such as Google Drive.\n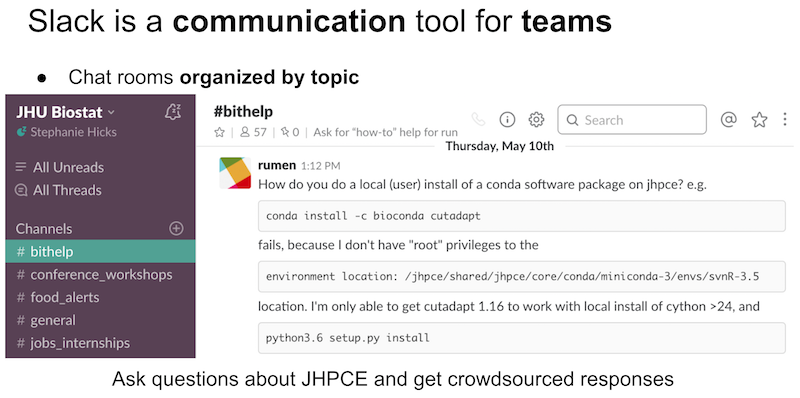{width=600px}\n[LCT] Slack is a website that provides access to a group of message channels bundled together in what they call a workspace. These channels can have specific purposes and different sets of members. Slack also provides many integrations with other software that we commonly use, like integration with GitHub, todo lists, Google Calendar, Google Docs, etc. The idea of using Slack is to keep your communications with close colleagues organized and make them more fluid than email. You might use the general channel for making broad announcements, such as an interesting talk from a guest. Then switch to a private channel with your 4 colleagues for that new secret project you are working on and discuss some ideas that would be useful to explore in more detail. And finally, switch to a one-on-one channel with your advisor and ask if you can meet for a few minutes that later today. Like many websites, Slack is also available as its own desktop and phone applications.\nHow do you use Slack? [SH] While I communicate with colleagues everyday on Slack, I think it’s important to distinguish between Slack and email. Both are important, I just use them for different purposes. I view communication on Slack to be for instant, real-time messaging and discussion to increase collaboration. These are usually short messages compassing a single idea. In contrast, I view email to be a slower, more deliberate medium. There is less expectation for immediate response. In both cases, you can always turn them off completely and enjoy some peace too!\n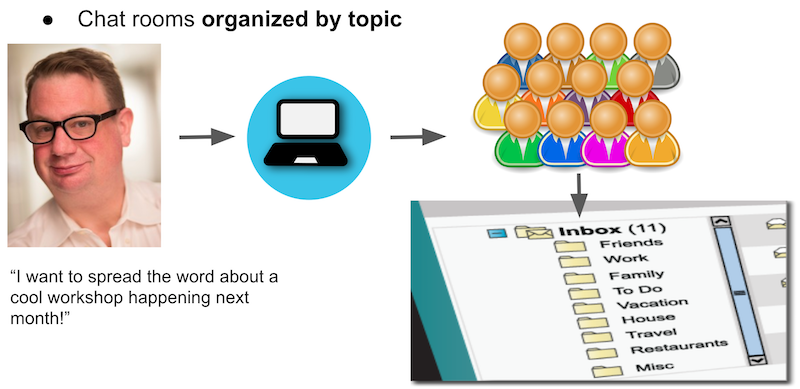{width=600px}\nversus\n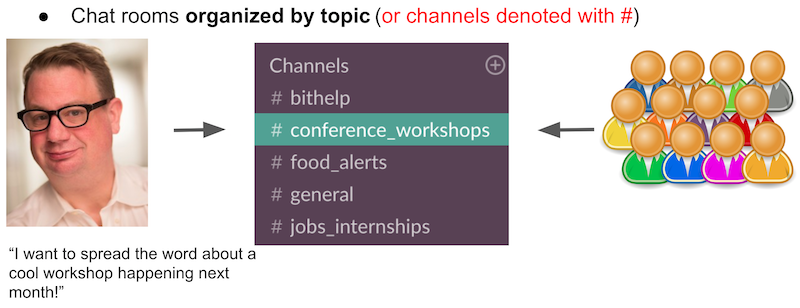{width=600px}\n[LCT] I’m part of multiple Slack workplaces (collections of channels and users) but I mostly use one with my genomics collaborators. There, we have a channel per project, some of which can be silent for weeks/months. But that’s ok, because I can always jump back to them and revise what we were talking about. We have a channel for R questions, one for the team that I’m a part of (Andrew Jaffe’s lab), one for organizing when and where to eat lunch, another one with the recount2 team, a diversity channel, one for our computing cluster JHPCE, among others. I also frequently ask and get asked questions on one-on-one channels with Andrew’s lab members and people elsewhere from our genomics workplace. I love using Twitter for networking in academia and keeping myself updated. So I also tend to share relevant news to specific channels I’m a part of. For the project specific channels I also use the integration with GitHub to keep everything in one place and reduce the chance of git merge issues :P\nWhat do you like about Slack? [SH] I recently transitioned from being a postdoctoral research fellow to an assistant professor. Many people warned me about the increase in the number of emails that I would receive. While that is certainly true, I would attribute Slack to being the biggest mitigator in reducing the number of emails that I have received. It reduces my email burden and increases communication between collaborators and colleagues. When an email sometimes seems too formal, Slack is perfect for sending out quick messages.\n[LCT] It greatly reduces the amount of emails and email chains. Also, I like having the option of more communication with all my colleagues …","date":1529366400,"expirydate":-62135596800,"kind":"page","lang":"en","lastmod":1689109377,"objectID":"b8a9d8d909fda3adbbb0f8467d0a3826","permalink":"https://lcolladotor.github.io/2018/06/19/using-slack-for-academic-departmental-communication/","publishdate":"2018-06-19T00:00:00Z","relpermalink":"/2018/06/19/using-slack-for-academic-departmental-communication/","section":"post","summary":"This is a joint blog post between Stephanie Hicks and Leonardo Collado-Torres. We want to share with you our experience using Slack and why you should join us. This post is in an interview style.","tags":["Academia","Help"],"title":"Using Slack for Academic Departmental Communication","type":"post"},{"authors":null,"categories":["Misc"],"content":"I recently participated for the first time in a silent retreat (6 hrs) as part of a Mindfulness-Based Stress Reduction course. I’ve really been enjoying this course and the experience of learning new ways (for me) to live better and enjoy life more. If you haven’t heard of mindfulness before (like me a few months ago), Wikipedia defines it as:\nMindfulness is the psychological process of bringing one\u0026#39;s attention to experiences occurring in the present moment, which can be developed through the practice of meditation and other training. In academia and science, but really anywhere, we can encounter many sources of stress (some examples below). We all deal with it in different ways and this MBSR course is just one that I’m liking right now and recommend. If there’s no course near you, check out the Full Catastrophe Living book that my course is based on1.\nAll these tweets are threads, so you’ll have to open them to see them: click on the blue bird on the right side of each tweet.\nI won an NSF grant yesterday, with three weeks to go before applying to tenure. A thread👇\n— Bryony DuPont (@BryonyDuPont) June 10, 2018 Just another barrier that us scientists in #developing #countries need to find ways to overcome. Not only do we have less funding, but also generating data that for other countries is routine is more expensive. #latin #american #scientists #plight https://t.co/Hln7N4x4iM\n— Daniela Robles @daniela-oaks.bsky.social (@daniela_oaks) June 7, 2018 Thanks for sharing this Ted! @tladeras As with anything, but particularly with mental health, I think it’s important to know you are not alone and that some things we feel have names: impostor syndrome, anxiety, depression, etc. Our minds are very powerful! #MentalHealthMatters https://t.co/X1UIAznV8f\n— 🇲🇽 Leonardo Collado-Torres (@lcolladotor) June 6, 2018 One of the exercises on our silent retreat was mindful eating. That is, eating slowly and focusing on our senses while eating food. This involved smelling the food, seeing all the colors it has, feeling all the different textures, and focusing on its taste. Plus, not talking to anyone. I had bought a lunch before the retreat (so I wouldn’t have to break the silence during it) that I normally don’t find interesting: some fruit and a chicken curry wrap from CVS. But wow, it was amazing that day! I greatly enjoyed how it tasted and all the different sensations I felt. I couldn’t believe it was the same food I had eaten other times before without much excitement.\nLately I’ve been processing some strong feelings related to feeling unwelcome, homesickness and loneliness. I’m doing many things that I know help me, starting with talking about them with my family. I’ve also been keeping myself busy doing some sports outside, going to events, bars, having friends over, etc. But what motivated me to write this post today is that after lunch I left really bad today. I had to go outside and try to calm myself.\nI thought I did, returned to work, and nah, I couldn’t do it today. So I went home, rested in my room in the dark, and I find myself finishing this post about 2 hours later. I’m not sure it’s related to the MSBR course, but I’m wondering if the mindfulness practice is also opening my mind’s ears and eyes to my inner feelings way more than normal2. I don’t think it’s bad. It’s just that it’s way harder to enjoy this process than it was eating a lunch. I’m trying to feel happy because I have feelings and I’m recognizing them. My family is also happy because they view it as a part of maturing and that I’m getting ready for taking another step in my life.\nJust some things are taking me way more time than normal. For example, it took me 2 days to process what I wanted to reply to a tweet and how to word it: it turned out well because I think we all heard each other ^^.\nThanks for the link @apreshill! I agree that the blog post was aweful! You can’t blame X for the fact that X is marginalized. However, I disagree with the notion that Z can’t talk about X (challenging). I’m in favor of inclusion. Otherwise that line of thought leads to xenophobia\n— 🇲🇽 Leonardo Collado-Torres (@lcolladotor) June 11, 2018 I also discovered that the silent retreat reminded me of vacations where I turn off my phone/email and spend a few days thinking about what’s next. I used to go to Mexico every 6 months or so during my PhD to recharge. I want to do it again, but I can’t. That lead me to my strong feelings of homesickness I had today.\nJust to close, I’m OK. I appreciate all the support I have and I recommend others to learn about mindfulness. You might be missing out some super tasty lunches and/or an exploration trip towards your inner self.\nI also want to add that I know some of you might see this post as over-sharing (yes, it might be). One reply is that I think that leaders also have to show their vulnerable sides. This has been debated a lot in academic twitter accounts in the context of showing your failures too, not just your successes. …","date":1528675200,"expirydate":-62135596800,"kind":"page","lang":"en","lastmod":1689109377,"objectID":"8ca351b9057fc37379043946d0368a5e","permalink":"https://lcolladotor.github.io/2018/06/11/mindfulness/","publishdate":"2018-06-11T00:00:00Z","relpermalink":"/2018/06/11/mindfulness/","section":"post","summary":"I recently participated for the first time in a silent retreat (6 hrs) as part of a Mindfulness-Based Stress Reduction course. I’ve really been enjoying this course and the experience of learning new ways (for me) to live better and enjoy life more.","tags":["Academia","Leader","Science","work-life"],"title":"Mindfulness","type":"post"},{"authors":["Leonardo Collado-Torres"],"categories":null,"content":" ","date":1527889941,"expirydate":-62135596800,"kind":"page","lang":"en","lastmod":1683613619,"objectID":"ab2595c87ce7efd0761fc19152450574","permalink":"https://lcolladotor.github.io/publication/poster2018sages/","publishdate":"2018-06-01T16:52:21-05:00","relpermalink":"/publication/poster2018sages/","section":"publication","summary":"Poster presented at SAGES2018","tags":["BrainSeq","Poster"],"title":"BrainSeq Phase II: schizophrenia-associated expression differences between the hippocampus and the dorsolateral prefrontal cortex","type":"publication"},{"authors":["Leonardo Collado-Torres"],"categories":null,"content":" ","date":1527685200,"expirydate":-62135596800,"kind":"page","lang":"en","lastmod":1621020950,"objectID":"71814a1996ac31505c11e243eebf6ed5","permalink":"https://lcolladotor.github.io/talk/lcg2018/","publishdate":"2018-05-30T13:00:00Z","relpermalink":"/talk/lcg2018/","section":"talk","summary":"Guest lecture for LCG-UNAM spanning some recent research","tags":["recount2","recount brain","LCG"],"title":"Reproducible RNA-seq analysis with recount2 and recount-brain","type":"talk"},{"authors":["Leonardo Collado-Torres"],"categories":null,"content":" ","date":1526137200,"expirydate":-62135596800,"kind":"page","lang":"en","lastmod":1621020950,"objectID":"497e3d1baabf136fee38b67b2666f447","permalink":"https://lcolladotor.github.io/talk/sobp2018/","publishdate":"2018-05-12T15:00:00Z","relpermalink":"/talk/sobp2018/","section":"talk","summary":"BrainSeq Phase II at SOBP 2018","tags":["BrainSeq"],"title":"Unique Molecular Correlates of Schizophrenia and Its Genetic Risk in the Hippocampus Compared to Frontal Cortex","type":"talk"},{"authors":["Leonardo Collado-Torres"],"categories":null,"content":" ","date":1526125200,"expirydate":-62135596800,"kind":"page","lang":"en","lastmod":1687274640,"objectID":"e3ad67c93a03d07b989e17eef0eb9fdd","permalink":"https://lcolladotor.github.io/talk/bog2018/","publishdate":"2018-05-12T11:40:00Z","relpermalink":"/talk/bog2018/","section":"talk","summary":"BrainSeq Phase II at Biology of Genomes 2018","tags":["BrainSeq"],"title":"BrainSeq Phase II: schizophrenia-associated expression differences between the hippocampus and the dorsolateral prefrontal cortex","type":"talk"},{"authors":null,"categories":["rstats"],"content":"It’s Friday 7pm and it’s been a long week with ups and downs1. But I’m enthused as I write this blog post. In less than a month from now I’ll be attending rOpenSci unconf18 and it’ll be my first time at this type of event. Yay!\nBuilding on my streak of good news, I\u0026#39;m delighted to have been selected to attend @rOpenSci #Unconf18 https://t.co/Xe6lojB7TS ^_^ Also, thanks to the https://t.co/o5OwUWEaBD and @LieberInstitute for their support! I\u0026#39;m hoping to relay as much as I can to @LIBDrstats #rstats\n— 🇲🇽 Leonardo Collado-Torres (@lcolladotor) April 11, 2018 In my self introduction to everyone attending, I mentioned that I don’t use the pipe (%\u0026gt;%) symbol and that I use \u0026lt;- for assignment.\nRecently I had my pre-unconf chat with [Stefanie Butland](https://ropensci.org/about/#team) (read more about these chats [in her great blog post](https://blog.trelliscience.com/the-value-of-welcome-part-2-how-to-prepare-40-new-community-members-for-an-unconference/)). In my notes to Stefanie before our chat I had mentioned again my lack of R piping experience and we talked about it. As we talked, it became clear that a blog post on related topics would be useful. Sure, I could have asked directly to the other unconf18 participants, but maybe others from the R community in general can chime in or benefit from reading the answers. Coding style and git I’m attending unconf18 with an open mind and I think of myself as someone who can be quite flexible (not with my body!) and accommodating. I’m assuming that most participants at unconf18 will use = for assignment. I’m not looking to start any discussions about the different assignment operators. Simply, I am willing to use whatever the majority uses. Just like I did in my first pull request to the blogdown package (issue 263). I was trying to follow Yihui Xie’s coding style to make his life easier and have a clean (or cleaner) git history. From Yihui’s post on this pull request I can see that he liked it.\nKeeping this in mind, I think that following the coding style of others will be something I’ll do at unconf18. I haven’t really worked in any R packages with many developers actively working on the package. But I imagine that setting a common coding style will minimize git conflicts, and no one wants those2. I don’t know if we’ll all follow some common guidelines at unconf18. I actually imagine that it’ll be project-specific. Why? Well because you can create an R project in RStudio3 and set some defaults for the project such as:\nthe number of spaces for tab line ending conversions We can also set some global RStudio preferences like whether to auto-indent code after paste, length of lines.\nAdditionally, we can decide whether we’ll use the RStudio “wand” to *reformat code*. Maybe all of this is unnecessary, maybe everyone will work in different non-overlapping functions and thus avoid git conflicts. For example, at my job sometimes I write code with = users, but we don’t work on the same lines of the code file. Later on it becomes easy to identify who wrote which line without having to use git blame (awful name, right?).\nTidyverse-like functions So far, I think that these coding style issues are minor and will be easily dealt with. I think that we’ll all be able to adapt and instead focus on other problems (like whatever the package is trying to solve) and enjoy the experience (network, build trust as Stefanie put it).\nMy second concern has to do with something I imagine could require more effort: my homework before the unconf. That is, writing tidyverse-like functions. Like I’ve said, I haven’t used the R pipe %\u0026gt;% symbol. I’ve executed some code with it before, seeing it in many blog posts, but I’ve never actually written functions designed to be compatible with this type of logic.\nIf I help write a function that is not pipe-friendly, then it might not integrate nicely with other functions written by the rest of the team. It would lead to workarounds in the vignette or maybe having someone else re-factor my first function to make it pipe-friendly. Sure, I would learn from observing others make changes to my code. But I want to take advantage as much as I can from my experience at rOpenSci unconf4!\nSince I don’t really use %\u0026gt;%, I’m unfamiliar with many things related to pipe-friendly (tidyverse-like) functions. For example:\nDo you document them differently? Like make a single Rd file for multiple functions. Or do you make an Rd file per function even if the example usage doesn’t involve %\u0026gt;%? I know that the first argument is important in pipe-friendly functions. But I ignore if the second and other arguments play a role or not. Do people use the ellipsis (...) argument in pipe-friendly functions? With my derfinder package I ended up a very deep rabbit hole using .... I explained some of the logic in my dots blog post (there are fair criticisms to going deep with ... in the comments). How do you write unit tests for pipe-friendly functions? Similar to how you write documentation for …","date":1524787200,"expirydate":-62135596800,"kind":"page","lang":"en","lastmod":1689109377,"objectID":"8f95a028c6984414614a3f13f84a512d","permalink":"https://lcolladotor.github.io/2018/04/27/ropensci-unconf18-and-working-on-tidyverse-like-functions-for-the-first-time/","publishdate":"2018-04-27T00:00:00Z","relpermalink":"/2018/04/27/ropensci-unconf18-and-working-on-tidyverse-like-functions-for-the-first-time/","section":"post","summary":"It’s Friday 7pm and it’s been a long week with ups and downs1. But I’m enthused as I write this blog post. In less than a month from now I’ll be attending rOpenSci unconf18 and it’ll be my first time at this type of event.","tags":["rstats","rOpenSci"],"title":"Getting ready to attend rOpenSci unconf18 and probably working on tidyverse-like functions for the first time","type":"post"},{"authors":null,"categories":["rstats","UNAM"],"content":"Today I’m excited to invite you to attend the Latin American R/BioConductor Developers Workshop 2018! It’ll be held in Cuernavaca, Mexico from July 30th to August 3rd, 2018. You can find the official announcement in the Bioconductor support website. Let me share with you why I’m excited about this workshop.\nAt BioC2017, Alejandro Reyes and I talked for a while about the low representation of Latin Americans through out the years that either of us have attended the BioC meetings1. We wanted to see more Latin faces in person but also in the Bioconductor Support Website and among package contributors. We brainstormed for a while and a at dinner with Bioconductor core members we simply ran with our ideas: we brought up the subject and were pleasantly rewarded with support from the Bioconductor team (Alejandro did most of the convincing!). That is, if we organized a conference/workshop, they would help us by sending someone to be one of the instructors.\nPreviously, Alejandro and I had already discussed why we like the Bioc meetings so much. One of the keys is that the Bioc meetings have always had events for different levels of R users. That is, you can attend the conference each year and learn something new (that’s how I got my career started). So you can progress from learning R, to mastering several R packages, to contributing R packages to Bioconductor, to brainstorming future directions for the Bioconductor project2. Additionally, the Bioc meetings have scientific talks in the mornings so that you can learn new scientific and R developments in a single conference. We’ve seen this model adapted in other Bioc events like BiocAsia, the European Bioconductor Meeting, etc. It would be ideal if we got to that point, but we wanted to start smaller with a focus on developing R packages.\nSeparately, Heladia Salgado, Romualdo Zayas and others from CCG-UNAM3 and NNB-UNAM4 have organized the “Talleres Internacionales de Bioinformática”5 (TIBs) for years now. Actually, I was a student in 2006 and gave a lecture in the summer 2010 event. At the TIBs they’ve had an introductory R class for a few years now where Selene Fernandez-Valverde and Alejandra Medina-Rivera have participated as instructors. Among the feedback they’ve received is the desire for a more advanced R course.\nAlejandro and I talked to Alejandra Medina-Rivera who shared our enthusiasm for Bioconductor. As a PI in Mexico, Alejandra knows very well how sparse are the R/Bioconductor courses that she can send her students to. By the way, Alejandra is the one who first invited me to attend BioC2008!6 We quickly started an email thread with Heladia and basically, the pieces started to fall in the right places. Heladia, Delfino Garcia-Alonso, Daniela Ledezma, Laura Gómez, Shirley Alquicira, Thalia Uranga Martínez, among others have been instrumental in organizing the workshop. Heladia, Alejandra and others also secured crucial funding from CCG-UNAM and LIIGH-UNAM. Together we were able to invite and get all the logistics so that Martin Morgan, Heather Turner, Benilton Carvalho, Selene Fernandez-Valverde, María Teresa Ortiz and Alicia Mastretta Yanes could all help us teach part of the workshop and/or present their work.\nBriefly, these are some of the reasons why they are amazing:\nMartin: Bioconductor project leader. Heather: extensive experience teaching R and bioinformatics. Benilton: he helped organize a similar workshop in 2015: LAb Foundation Brasil. Also an academic relative of Alejandro and myself. Selene: L’Oréal-UNESCO For Women in Science, has taught at TIBs before. Teresa: RLadiesCDMX plus just look at her awesome GitHub profile! Alicia: she has taught an intro to bioinformatics and reproducible genetic analyses course, plus check her GitHub profile! If you check the workshop schedule we have, you’ll notice that we will have several sessions devoted to actually writing R packages. So the course will cover both the theory and the practice side of things. If you attend the workshop, you’ll have plenty of opportunities to network with your peers and to learn from other R developers. You should be super excited now!! ^^ Plus we have a code of conduct (en Español) to ensure that the conference will be welcoming to everyone.\nThis is also a reminder that you have to keep trying. Back in 2009 or 2010 I had gotten an offer of support from Bioc for sending someone to Cuernavaca, but due to funding circumstances it fell through. Like I said, all the pieces fell in the right places this time. Plus Heladia Salgado has made it all possible!\n2018 is looking like a good year for R courses in Latin America. For example, there’s LatinR and Buenos Aires RLadies plus our workshop! Fingers crossed, I’ll be able to attend the workshop in 2019!\nAgain, I’m excited to invite you to attend the Latin American R/BioConductor Developers Workshop 2018! Regardless of whether you can attend it, help us spread the word:\nBioc Support website: https://support.bioconductor.org/p/108108/ …","date":1524096000,"expirydate":-62135596800,"kind":"page","lang":"en","lastmod":1689109377,"objectID":"e711b1861e08c37fdb14f40e3c5e331c","permalink":"https://lcolladotor.github.io/2018/04/19/latin-american-r-bioconductor-developers-workshop-2018/","publishdate":"2018-04-19T00:00:00Z","relpermalink":"/2018/04/19/latin-american-r-bioconductor-developers-workshop-2018/","section":"post","summary":"Today I’m excited to invite you to attend the Latin American R/BioConductor Developers Workshop 2018! It’ll be held in Cuernavaca, Mexico from July 30th to August 3rd, 2018. You can find the official announcement in the Bioconductor support website.","tags":["Bioconductor","rstats","Teaching"],"title":"Latin American R/BioConductor Developers Workshop 2018","type":"post"},{"authors":["Leonardo Collado-Torres"],"categories":null,"content":" ","date":1523962800,"expirydate":-62135596800,"kind":"page","lang":"en","lastmod":1621020950,"objectID":"68c2692baca9b06bf5c42712741b33c0","permalink":"https://lcolladotor.github.io/talk/dennisdal2018/","publishdate":"2018-04-17T11:00:00Z","relpermalink":"/talk/dennisdal2018/","section":"talk","summary":"recount2 overview for the webinar organized by Dennis Dal","tags":["recount2"],"title":"recount workflow: Accessing over 70,000 human RNA-seq samples with Bioconductor","type":"talk"},{"authors":null,"categories":["rstats"],"content":"In a recent blog post I wrote about having a template for blogdown posts. I wanted to know if it was possible to do this and make my life (and others hopefully) easier for writing new blog posts that are ready to go with the features I frequently re-use.\nIn my case, I like using BiocStyle (Oleś, 2023) for functions such as CRANpkg(), Biocpkg() and Githubpkg(). I also like using knitcitations (Boettiger, 2021) for citing with citep() packages or papers; I use citation() and bib_metadata() to get the necessary information, respectively. Furthermore, I prefer devtools::session_info() (Wickham, Hester, Chang, and Bryan, 2022) over sessionInfo() since it provides information of where you got the package, which becomes specially relevant when using packages from GitHub. Finally, I like thanking the creators of the tools I use, which in this case is blogdown (Xie, Hill, and Thomas, 2017).\nI also like reminding myself how to do some common tasks. Basically, the equivalent of the new R Markdown file you get when using RStudio. In my case, I want to remind myself of the YAML options I frequently use (toc, fig height and width) or how to add screenshots.\nMy first post on this topic is actually rather messy. That’s because at that time:\nI didn’t know about hugo archetypes which are template files, I hadn’t even thought of making the Insert Image addin. I went down the rabbit hole of archetypes and blogdown, reported an issue resulated to this topic that was in the way of using archetypes for .Rmd posts. After some encouragement by Yihui Xie, I ended up fixing this issues in my first pull request ever to an RStudio package. The PR also added the Archetype option to the New Post RStudio addin (which I used right now ^^).\nCreating my blogdown archetype (template) To make my archetype (template) for blog posts I looked at the GitHub repo for the theme I’m using. It contains an archetypes directory with several files. I just looked at the one called post.md (check it here) and copied it from themes/hugo-academic/archetypes/post.md to archetypes/post.md. Next I added my favorite R code below the last +++ mark. You can check out the final version here. Below I display the version at the time of writing this blog post (I’m using a .txt extension otherwise the embedded gist doesn’t look good, but you want it to end in .md).\nI couldn’t get the archetype to respect some of the YAML that blogdown adds, but well, that’s a single copy-paste I have to do now (if I actually decide to use the custom YAML options which are only for .Rmd posts).\nI encourage you to make your own blogdown archetype (template). At least it should remind you to include reproducibility information which matters whenever any R code is involved.\nAcknowledgments This blog post was made possible thanks to:\nBiocStyle (Oleś, 2023) blogdown (Xie, Hill, and Thomas, 2017) devtools (Wickham, Hester, Chang, and Bryan, 2022) knitcitations (Boettiger, 2021) Yihui Xie also talked about my first PR in his blog.\nReferences [1] C. Boettiger. knitcitations: Citations for \u0026#39;Knitr\u0026#39; Markdown Files. R package version 1.0.12. 2021. URL: https://CRAN.R-project.org/package=knitcitations.\n[2] A. Oleś. BiocStyle: Standard styles for vignettes and other Bioconductor documents. R package version 2.28.0. 2023. DOI: 10.18129/B9.bioc.BiocStyle. URL: https://bioconductor.org/packages/BiocStyle.\n[3] H. Wickham, J. Hester, W. Chang, and J. Bryan. devtools: Tools to Make Developing R Packages Easier. R package version 2.4.5. 2022. URL: https://CRAN.R-project.org/package=devtools.\n[4] Y. Xie, A. P. Hill, and A. Thomas. blogdown: Creating Websites with R Markdown. Boca Raton, Florida: Chapman and Hall/CRC, 2017. ISBN: 978-0815363729. URL: https://bookdown.org/yihui/blogdown/.\nReproducibility ## ─ Session info ─────────────────────────────────────────────────────────────────────────────────────────────────────── ## setting value ## version R version 4.3.1 (2023-06-16) ## os macOS Ventura 13.4 ## system aarch64, darwin20 ## ui X11 ## language (EN) ## collate en_US.UTF-8 ## ctype en_US.UTF-8 ## tz America/New_York ## date 2023-07-11 ## pandoc 3.1.5 @ /opt/homebrew/bin/ (via rmarkdown) ## ## ─ Packages ─────────────────────────────────────────────────────────────────────────────────────────────────────────── ## package * version date (UTC) lib source ## backports 1.4.1 2021-12-13 [1] CRAN (R 4.3.0) ## bibtex 0.5.1 2023-01-26 [1] CRAN (R 4.3.0) ## BiocManager 1.30.21 2023-06-10 [1] CRAN (R 4.3.0) ## BiocStyle * 2.28.0 2023-04-25 [1] Bioconductor ## blogdown 1.18 2023-06-19 [1] CRAN (R 4.3.0) ## bookdown 0.34 2023-05-09 [1] CRAN (R 4.3.0) ## bslib 0.5.0 2023-06-09 [1] CRAN (R 4.3.0) ## cachem 1.0.8 2023-05-01 [1] CRAN (R 4.3.0) ## callr 3.7.3 2022-11-02 [1] CRAN (R 4.3.0) ## cli 3.6.1 2023-03-23 [1] CRAN (R 4.3.0) ## colorout 1.2-2 2023-05-06 [1] Github (jalvesaq/colorout@79931fd) ## crayon 1.5.2 2022-09-29 [1] CRAN (R 4.3.0) ## devtools * 2.4.5 2022-10-11 [1] CRAN (R 4.3.0) ## digest 0.6.31 2022-12-11 …","date":1520467200,"expirydate":-62135596800,"kind":"page","lang":"en","lastmod":1689109377,"objectID":"876622c5eeabd1d79037c09de116426b","permalink":"https://lcolladotor.github.io/2018/03/08/blogdown-archetype-template/","publishdate":"2018-03-08T00:00:00Z","relpermalink":"/2018/03/08/blogdown-archetype-template/","section":"post","summary":"In a recent blog post I wrote about having a template for blogdown posts. I wanted to know if it was possible to do this and make my life (and others hopefully) easier for writing new blog posts that are ready to go with the features I frequently re-use.","tags":["Blog","rstats"],"title":"blogdown archetype (template)","type":"post"},{"authors":null,"categories":["rstats"],"content":"Have you ever tried inserting an image into a blogdown post? Maybe you have, or maybe you tried and gave up. Lets first review the hard way before getting to the solution I contributed.\nThe hard way The process involves copying the target image to the static directory that corresponds to the blogdown post. Lets say that your post is called 2018-03-07-my-new-post.Rmd and lives at content/post/, so it’s full path is content/post/2018-03-07-my-new-post.Rmd. When you run the RStudio blogdown addin Serve Site, behind curtains the directory static/post/2018-03-07-my-new-post_files is created and inside it you can find the images made by your R code: likely at static/post/2018-03-07-my-new-post_files/figure_html.\nSo far everything is working! But now you want to add a screenshot or some other image to your blog post. Lets say that your image is ~/Desktop/screenshot.jpg. Your ~/Desktop directory is not part of your blogdown directory and well, simply put, your website won’t find the image. We need to put it in a location that will be made public by hugo. That is, we need to put it inside static/post/2018-03-07-my-new-post_files (or anywhere inside static, but we like to keep things tidy!).\nOk, so we copy our screenshot file ~/Desktop/screenshot.jpg and save it as static/post/2018-03-07-my-new-post_files/screenshot.jpg. The next time we render our site and publish it, the figure will be available in the web. But it’s still not part of our blogdown post.\nSo we need to use either the Markdown or HTML syntax for adding the image. Maybe your initial thought is to use:\n Except that will not work. We need to use almost all the path (just remove static) as shown below:\n If you want to edit the height or width, then you need to use the HTML syntax. Something like:\n\u0026lt;img alt = \u0026#39;my new screenshot\u0026#39; width=\u0026#39;200\u0026#39; src=\u0026#39;/post/2018-03-07-my-new-post_files/screenshot.jpg\u0026#39; /\u0026gt; hard way notes You could have also used knitr::include_graphics() and let blogdown copy it to the final location in static and link to it appropriately. However, you would have to keep your original images organized in a way that won’t bother hugo.\nAnother option that I used for a while, even in the days when my blog was based on Jekyll, is to render the figures yourself and copy the directory with the figures, plus mess around with how they are linked from R. Details here. Not something I recommend doing now.\nInsert Image addin: aka, the easy way If you are using blogdown, you most likely (you should if you can) are using RStudio and the great blogdown addins: New Post and Serve Site. I just recently started using them in the past few days and looking at the code I realized that it should be possible to make an addin that lets you:\nselect a target image, copies the target image to the appropriate location under static, gives you the correct code for linking the image. Yihui Xie loved the idea (I think it’s fair to say that ^^) and helped me polish it in the pull request that implements it. He then refined the code even more!\nFeatures of the Insert Image addin The final features, at least as implemented in blogdown version 0.5.7 are:\nSelect an image from anywhere in your computer. Automatically generate a candidate final location for your image under static, which you can edit. Useful if you want to rename the final figure. Allow specifying the alternate description of the image (alt), height and width. If the target image file exists, a dynamic menu shows up that asks you whether to overwrite it or not. The final syntax is Markdown unless a width or height are used, in which case it uses HTML code. Yihui Xie hinted at other possible future features, which maybe you can help implement.\nUsing the Insert Image addin Step 1: install appropriate blogdown version First of all, at the time of writing this post, you need the development version of blogdown. You can install it with:\n## Check if you have version 0.5.7 or newer ## I actually used version 0.5.9 for this blog post packageVersion(\u0026#39;blogdown\u0026#39;) ## If not, then get it! ##### If necessary: ## install.packages(\u0026#39;devtools\u0026#39;) devtools::install_github(\u0026#39;rstudio/blogdown\u0026#39;) You also need an up to date version of RStudio and I recommend also using R 3.4.x (or newer if you are reading this in the future). Re-start RStudio so it loads the new version of blogdown.\nStep 2: open the Insert Image addin Second, go to the Addins menu in the top section of the RStudio window and select the Insert Image blogdown addin.\nStep 3: choose figure and inputs So far the Insert Image addin looks like this:\nSo lets go head and select an image we want to upload. In my case, I chose an image that already exists.\nYou can rename the figure if you want, and if it doesn’t exist, the overwrite option goes away.\nStep 4: hit done! Lets go ahead and click done! Our text window in RStudio will insert the appropriate code for linking the image. In this case, it’s the following code: …","date":1520380800,"expirydate":-62135596800,"kind":"page","lang":"en","lastmod":1689109377,"objectID":"bf26bb2c53033899d2d598dd7a7e131b","permalink":"https://lcolladotor.github.io/2018/03/07/blogdown-insert-image-addin/","publishdate":"2018-03-07T00:00:00Z","relpermalink":"/2018/03/07/blogdown-insert-image-addin/","section":"post","summary":"Have you ever tried inserting an image into a blogdown post? Maybe you have, or maybe you tried and gave up. Lets first review the hard way before getting to the solution I contributed.","tags":["Blog","rstats"],"title":"blogdown Insert Image addin","type":"post"},{"authors":["Shannon SE","Leonardo Collado-Torres","Jaffe AE","Leek JT"],"categories":null,"content":" Congrats to @Shannon_E_Ellis on her work improving the value of public genomic data by phenotype prediction now out at @NAR_Open: https://t.co/SWQvTuKMxk you can get the predictions from the recount package: https://t.co/y8CDPephE4 pic.twitter.com/jjTQIePKet\n— Jeff Leek (@jtleek) March 5, 2018 Access all of @Shannon_E_Ellis’s predictions by using recount::add_predictions() [with no rse argument] in recount version \u0026gt;= 1.5.9. Great work Shannon! #rstats #rnaseq #bioinformatics https://t.co/g0yt90AzSp\n— 🇲🇽 Leonardo Collado-Torres (@lcolladotor) March 6, 2018 ","date":1520286343,"expirydate":-62135596800,"kind":"page","lang":"en","lastmod":1651425968,"objectID":"370862082a0018c8ef6d3ed1231d394e","permalink":"https://lcolladotor.github.io/publication/2018-03_rnaseq_prediction/","publishdate":"2018-03-05T16:45:43-05:00","relpermalink":"/publication/2018-03_rnaseq_prediction/","section":"publication","summary":"Background: Publicly available genomic data are a valuable resource for studying normal human variation and disease, but these data are often not well labeled or annotated. The lack of phenotype information for public genomic data severely limits their utility for addressing targeted biological questions. Results: We develop an in silico phenotyping approach for predicting critical missing annotation directly from genomic measurements using, well-annotated genomic and phenotypic data produced by consortia like TCGA and GTEx as training data. We apply in silico phenotyping to a set of 70,000 RNA-seq samples we recently processed on a common pipeline as part of the recount2 project (https://jhubiostatistics.shinyapps.io/recount/). We use gene expression data to build and evaluate predictors for both biological phenotypes (sex, tissue, sample source) and experimental conditions (sequencing strategy). We demonstrate how these predictions can be used to study cross-sample properties of public genomic data, select genomic projects with specific characteristics, and perform downstream analyses using predicted phenotypes. The methods to perform phenotype prediction are available in the phenopredict R package (https://github.com/leekgroup/phenopredict) and the predictions for recount2 are available from the recount R package (https://bioconductor.org/packages/release/bioc/html/recount.html). Conclusion: Having leveraging massive public data sets to generate a well-phenotyped set of expression data for more than 70,000 human samples, expression data is available for use on a scale that was not previously feasible.","tags":["recount2"],"title":"Improving the value of public RNA-seq expression data by phenotype prediction","type":"publication"},{"authors":null,"categories":["rstats"],"content":"This blog post is mostly for myself but maybe it’s useful to others. It contains my current R markdown blog template. I initially posted this as a question at StackOverflow. Then I read how much a burden we put in Yihui Xie and decided that my current setup (copy-pasting) works just fine. In any case using blogdown with the RStudio IDE is much simpler than what I used to do in the past with jekyll or with even my prior setup with blogdown.\nBibliography setup First I define the citation information I’ll need. By the way, I used FAQ 7 for showing the R code chunk.\n```{r bibsetup, echo=FALSE, message=FALSE, warning=FALSE} ## Load knitcitations with a clean bibliography library(\u0026#39;knitcitations\u0026#39;) cleanbib() cite_options(hyperlink = \u0026#39;to.doc\u0026#39;, citation_format = \u0026#39;text\u0026#39;, style = \u0026#39;html\u0026#39;) bib \u0026lt;- c(\u0026#39;knitcitations\u0026#39; = citation(\u0026#39;knitcitations\u0026#39;), \u0026#39;blogdown\u0026#39; = citation(\u0026#39;blogdown\u0026#39;)[2]) ``` Post content This is where I typically start to edit since the bibliography chunk is hidden.\nR image ```{r \u0026#39;plot\u0026#39;} ## This will create the /post/*_files/ directory ## where you can later copy the non-R images you want to use ## in the blog post plot(1:10, 10:1) ``` Note that I modified the YAML portion of the post to set the figure width and height. You can also include a table of contents if you want, though it affects the summary of the post. Check the output format section of the blogdown book for more details (Xie, Hill, and Thomas, 2017), including differences between .Rmd and .Rmarkdown files. Note that you can also use a _output.yml file as described there.\noutput: blogdown::html_page: toc: no fig_width: 5 fig_height: 5 Custom image syntax Here I remind myself of different ways I can include external images. Check blogdown issue 239 for some background information.\nMarkdown syntax for custom image:\n HTML syntax for centering image, including a link, and re-sizing the image to a fix width of 200 px.\n\u0026lt;center\u0026gt; \u0026lt;a href=\u0026#34;http://lcolladotor.github.io/\u0026#34;\u0026gt;\u0026lt;img alt = \u0026#39;some website\u0026#39; width=\u0026#39;200\u0026#39; src=\u0026#39;/post/2018-02-17-r-markdown-blog-template_files/LIBD.jpg\u0026#39; /\u0026gt;\u0026lt;/a\u0026gt; \u0026lt;/center\u0026gt; Reproducibility ## Reproducibility info library(\u0026#39;devtools\u0026#39;) ## Loading required package: usethis options(width = 120) session_info() ## ─ Session info ─────────────────────────────────────────────────────────────────────────────────────────────────────── ## setting value ## version R version 4.3.1 (2023-06-16) ## os macOS Ventura 13.4 ## system aarch64, darwin20 ## ui X11 ## language (EN) ## collate en_US.UTF-8 ## ctype en_US.UTF-8 ## tz America/New_York ## date 2023-07-11 ## pandoc 3.1.5 @ /opt/homebrew/bin/ (via rmarkdown) ## ## ─ Packages ─────────────────────────────────────────────────────────────────────────────────────────────────────────── ## package * version date (UTC) lib source ## backports 1.4.1 2021-12-13 [1] CRAN (R 4.3.0) ## bibtex 0.5.1 2023-01-26 [1] CRAN (R 4.3.0) ## blogdown 1.18 2023-06-19 [1] CRAN (R 4.3.0) ## bookdown 0.34 2023-05-09 [1] CRAN (R 4.3.0) ## bslib 0.5.0 2023-06-09 [1] CRAN (R 4.3.0) ## cachem 1.0.8 2023-05-01 [1] CRAN (R 4.3.0) ## callr 3.7.3 2022-11-02 [1] CRAN (R 4.3.0) ## cli 3.6.1 2023-03-23 [1] CRAN (R 4.3.0) ## colorout 1.2-2 2023-05-06 [1] Github (jalvesaq/colorout@79931fd) ## crayon 1.5.2 2022-09-29 [1] CRAN (R 4.3.0) ## devtools * 2.4.5 2022-10-11 [1] CRAN (R 4.3.0) ## digest 0.6.31 2022-12-11 [1] CRAN (R 4.3.0) ## ellipsis 0.3.2 2021-04-29 [1] CRAN (R 4.3.0) ## evaluate 0.21 2023-05-05 [1] CRAN (R 4.3.0) ## fastmap 1.1.1 2023-02-24 [1] CRAN (R 4.3.0) ## fs 1.6.2 2023-04-25 [1] CRAN (R 4.3.0) ## generics 0.1.3 2022-07-05 [1] CRAN (R 4.3.0) ## glue 1.6.2 2022-02-24 [1] CRAN (R 4.3.0) ## highr 0.10 2022-12-22 [1] CRAN (R 4.3.0) ## htmltools 0.5.5 2023-03-23 [1] CRAN (R 4.3.0) ## htmlwidgets 1.6.2 2023-03-17 [1] CRAN (R 4.3.0) ## httpuv 1.6.11 2023-05-11 [1] CRAN (R 4.3.0) ## httr 1.4.6 2023-05-08 [1] CRAN (R 4.3.0) ## jquerylib 0.1.4 2021-04-26 [1] CRAN (R 4.3.0) ## jsonlite 1.8.7 2023-06-29 [1] CRAN (R 4.3.0) ## knitcitations * 1.0.12 2021-01-10 [1] CRAN (R 4.3.0) ## knitr 1.43 2023-05-25 [1] CRAN (R 4.3.0) ## later 1.3.1 2023-05-02 [1] CRAN (R 4.3.0) ## lifecycle 1.0.3 2022-10-07 [1] CRAN (R 4.3.0) ## lubridate 1.9.2 2023-02-10 [1] CRAN (R 4.3.0) ## magrittr 2.0.3 2022-03-30 [1] CRAN (R 4.3.0) ## memoise 2.0.1 2021-11-26 [1] CRAN (R 4.3.0) ## mime 0.12 2021-09-28 [1] CRAN (R 4.3.0) ## miniUI 0.1.1.1 2018-05-18 [1] CRAN (R 4.3.0) ## pkgbuild 1.4.2 2023-06-26 [1] CRAN (R 4.3.0) ## pkgload 1.3.2 2022-11-16 [1] CRAN (R 4.3.0) ## plyr 1.8.8 2022-11-11 [1] CRAN (R 4.3.0) ## prettyunits 1.1.1 2020-01-24 [1] CRAN (R 4.3.0) ## processx 3.8.2 2023-06-30 [1] CRAN (R 4.3.0) ## profvis 0.3.8 2023-05-02 [1] CRAN (R 4.3.0) ## promises 1.2.0.1 2021-02-11 [1] CRAN (R 4.3.0) ## ps 1.7.5 2023-04-18 [1] CRAN (R 4.3.0) ## purrr 1.0.1 2023-01-10 [1] CRAN (R 4.3.0) ## R6 2.5.1 2021-08-19 [1] CRAN (R 4.3.0) ## Rcpp 1.0.10 2023-01-22 [1] CRAN (R 4.3.0) ## RefManageR 1.4.0 2022-09-30 [1] CRAN (R …","date":1518825600,"expirydate":-62135596800,"kind":"page","lang":"en","lastmod":1689109377,"objectID":"7e7fdf47c87ec0b2604507003385078c","permalink":"https://lcolladotor.github.io/2018/02/17/r-markdown-blog-template/","publishdate":"2018-02-17T00:00:00Z","relpermalink":"/2018/02/17/r-markdown-blog-template/","section":"post","summary":"This blog post is mostly for myself but maybe it’s useful to others. It contains my current R markdown blog template. I initially posted this as a question at StackOverflow. Then I read how much a burden we put in Yihui Xie and decided that my current setup (copy-pasting) works just fine.","tags":["rstats","Blog"],"title":"R markdown blog template","type":"post"},{"authors":["Fu J","Kammers K","Nellore A","Leonardo Collado-Torres","Leek JT","Taub MA"],"categories":null,"content":" We now have transcript abundances for recount2! https://t.co/7z6fcJ6qwF\n— Jack Fu (@JFuBiostats) January 13, 2018 ","date":1515793543,"expirydate":-62135596800,"kind":"page","lang":"en","lastmod":1651425968,"objectID":"a620a398a5c92addefef37b3a4ddb448","permalink":"https://lcolladotor.github.io/publication/preprint_recount_tx/","publishdate":"2018-01-12T16:45:43-05:00","relpermalink":"/publication/preprint_recount_tx/","section":"publication","summary":"More than 70,000 short-read RNA-sequencing samples are publicly available through the recount2 project, a curated database of summary coverage data. However, no current methods can estimate transcript-level abundances using the reduced-representation information stored in this database. Here we present a linear model utilizing coverage of junctions and subdivided exons to generate transcript abundance estimates of comparable accuracy to those obtained from methods requiring read-level data. Our approach flexibly models bias, produces standard errors, and is easy to refresh given updated annotation. We illustrate our method on simulated and real data and release transcript abundance estimates for the samples in recount2.","tags":["recount2"],"title":"RNA-seq transcript quantification from reduced-representation data in recount2","type":"publication"},{"authors":["Leonardo Collado-Torres"],"categories":null,"content":" ","date":1508536341,"expirydate":-62135596800,"kind":"page","lang":"en","lastmod":1683613619,"objectID":"ed2f316179c7b5cec03a17f9cd1f1e95","permalink":"https://lcolladotor.github.io/publication/poster2017idies/","publishdate":"2017-10-20T16:52:21-05:00","relpermalink":"/publication/poster2017idies/","section":"publication","summary":"Poster presented at IDIES2017","tags":["recount2","Poster"],"title":"Getting started with recount2 and accessing it via R","type":"publication"},{"authors":["[__L Collado-Torres__](/authors/admin) \u0026dagger;","A Nellore","AE Jaffe"],"categories":null,"content":" Check our new recount workflow paper at https://t.co/p0l2IQ9PL7 with @AbhiNellore @andrewejaffe ^^ #rstats @Bioconductor @LieberInstitute\n— 🇲🇽 Leonardo Collado-Torres (@lcolladotor) August 24, 2017 ","date":1503611143,"expirydate":-62135596800,"kind":"page","lang":"en","lastmod":1651425968,"objectID":"3288459971c3638c3b3d4e83afc06cd0","permalink":"https://lcolladotor.github.io/publication/2017-08_recountworkflow/","publishdate":"2017-08-24T16:45:43-05:00","relpermalink":"/publication/2017-08_recountworkflow/","section":"publication","summary":"The recount2 resource is composed of over 70,000 uniformly processed human RNA-seq samples spanning TCGA and SRA, including GTEx. The processed data can be accessed via the recount2 website and the recount Bioconductor package. This workflow explains in detail how to use the recount package and how to integrate it with other Bioconductor packages for several analyses that can be carried out with the recount2 resource. In particular, we describe how the coverage count matrices were computed in recount2 as well as different ways of obtaining public metadata, which can facilitate downstream analyses. Step-by-step directions show how to do a gene-level differential expression analysis, visualize base-level genome coverage data, and perform an analyses at multiple feature levels. This workflow thus provides further information to understand the data in recount2 and a compendium of R code to use the data.","tags":["recount2"],"title":"recount workflow: Accessing over 70,000 human RNA-seq samples with Bioconductor [version 1; referees: 1 approved, 2 approved with reservations]","type":"publication"},{"authors":["Leonardo Collado-Torres"],"categories":null,"content":" ","date":1501749000,"expirydate":-62135596800,"kind":"page","lang":"en","lastmod":1621020950,"objectID":"69eb98ade5b234dbe6f65dca5c922fb8","permalink":"https://lcolladotor.github.io/talk/jsm2017/","publishdate":"2017-08-03T08:30:00Z","relpermalink":"/talk/jsm2017/","section":"talk","summary":"Overview of some of our work at LIBD on the field of interactive displays","tags":["BrainSeq"],"title":"Guiding Principles for Interactive Graphics Based on LIBD Data Science Projects","type":"talk"},{"authors":null,"categories":null,"content":"The Lieber Institute and pharmaceutical companies AstraZeneca, Astellas, Eli Lilly and Company, Lundbeck, Johnson \u0026amp; Johnson, Pfizer Inc. and Roche are participating in an early-stage research consortium BrainSEQ™, with the goal of expanding knowledge around the genetic contribution to brain disorders in the hope of identifying potential new treatment options.\nUtilizing LIBD’s unprecedented brain tissue repository to generate and analyze genomic data related to neuropsychiatric disorders. Making data freely available to scientists worldwide. As part of the BrainSEQ Consortium, Leonardo analyzed datasets from Phase I and II, either for the publications describing those phases or for re-analyses of the same data. As a team, we then adapted this code base for the BipSeq and MDDSeq projects, among other ones.\n","date":1501718400,"expirydate":-62135596800,"kind":"page","lang":"en","lastmod":1683606876,"objectID":"07036e58feab47111904741c42357846","permalink":"https://lcolladotor.github.io/project/brainseq/","publishdate":"2017-08-03T00:00:00Z","relpermalink":"/project/brainseq/","section":"project","summary":"BrainSeq Consortium lead by LIBD to understand the genetics and gene expression variability in psychiatric disorder including schizorphenia, bipolar disorder, and major depression disorder.","tags":["BrainSeq","bulk"],"title":"BrainSEQ™ Consortium","type":"project"},{"authors":["Leonardo Collado-Torres"],"categories":null,"content":" ","date":1501162200,"expirydate":-62135596800,"kind":"page","lang":"en","lastmod":1621020950,"objectID":"23e7e5e792bfa4a1eb8df04f19b5d607","permalink":"https://lcolladotor.github.io/talk/bioc2017/","publishdate":"2017-07-27T13:30:00Z","relpermalink":"/talk/bioc2017/","section":"talk","summary":"R/Bioconductor workshop on how to use recount2","tags":["recount2"],"title":"recount workshop: Learn to leverage 70,000 human RNA-seq samples for your projects","type":"talk"},{"authors":["Leonardo Collado-Torres"],"categories":null,"content":" ","date":1498570200,"expirydate":-62135596800,"kind":"page","lang":"en","lastmod":1621020950,"objectID":"1278c828daa62a42d188a13cee112afb","permalink":"https://lcolladotor.github.io/talk/icsa2017/","publishdate":"2017-06-27T13:30:00Z","relpermalink":"/talk/icsa2017/","section":"talk","summary":"recount2 overview for the ICSA 2017 conference","tags":["recount2","derfinder"],"title":"Reproducible RNA-seq analysis with recount2","type":"talk"},{"authors":["Leonardo Collado-Torres"],"categories":null,"content":" ","date":1498293000,"expirydate":-62135596800,"kind":"page","lang":"en","lastmod":1621020950,"objectID":"0241948e407ccdd8a30053b3f3ee29e0","permalink":"https://lcolladotor.github.io/talk/reproducibility2017/","publishdate":"2017-06-24T08:30:00Z","relpermalink":"/talk/reproducibility2017/","section":"talk","summary":"Guest lecture on Reproducibility Research and Bioinformatics","tags":["Reproducibility"],"title":"Reproducible Research and Bioinformatics","type":"talk"},{"authors":["Leonardo Collado-Torres"],"categories":null,"content":"","date":1495283400,"expirydate":-62135596800,"kind":"page","lang":"en","lastmod":1621020950,"objectID":"9cef39a3a2cfbe5f6fca8f80c056b1c5","permalink":"https://lcolladotor.github.io/talk/sobp2017/","publishdate":"2017-05-20T12:30:00Z","relpermalink":"/talk/sobp2017/","section":"talk","summary":"Showcasing how derfinder and recount2 can be used together to perform annotation-agnostic RNA-seq analyses at SOBP2017","tags":["recount2","derfinder"],"title":"RNA-seq samples beyond the known transcriptome with derfinder available via recount2","type":"talk"},{"authors":["C Wright","JH Shin","A Rajpurohit","A Deep-Soboslay","[__L Collado-Torres__](/authors/admin)","NJ Brandon","TM Hyde","JE Kleinman","AE Jaffe","AJ Cross","DR Weinberger"],"categories":null,"content":" Check out @LieberInstitute’s new paper about ASD and histamine genes lead by C Wright https://t.co/bK33j67iAc Made figure 1 with #rstats ^^\n— 🇲🇽 Leonardo Collado-Torres (@lcolladotor) May 10, 2017 ","date":1494366343,"expirydate":-62135596800,"kind":"page","lang":"en","lastmod":1651425968,"objectID":"a4c337a8ec1ff4526e2f770ecd42f58f","permalink":"https://lcolladotor.github.io/publication/2017-05_histamine/","publishdate":"2017-05-09T16:45:43-05:00","relpermalink":"/publication/2017-05_histamine/","section":"publication","summary":"Expression of the gene set of HNMT, HRH1, HRH2 and HRH3 was significantly altered between ASD and matched controls, and this finding was replicated with an independent data set.","tags":["Histamine"],"title":"Altered expression of histamine signaling genes in autism spectrum disorder","type":"publication"},{"authors":null,"categories":["rstats"],"content":"As you might know by now, the latest R version was recently released (R 3.4.0). That means that you are highly encouraged to update your R installation. There are several ways to do this some of which are documented in these other blog posts: Tal Galili, 2013, Kris Eberwein, 2015. You would think that it’s just a matter of downloading the latest R installer for your OS, installing it, and continuing your analysis. The reality is a bit more complicated. The following short steps will make your life easier.\nSave your list of currently installed packages If you want to continue using R with all the packages you previously had installed, the best way is to save the list of packages you currently have before installing a new R version. You can do so with these lines of code:\n## Change accordingly list_dir \u0026lt;- \u0026#39;/Users/lcollado/Dropbox/Computing/R\u0026#39; ## Get the list of installed packages installed \u0026lt;- dir(.libPaths()) ## Save the list for later use save(installed, file = file.path(list_dir, paste0(Sys.Date(), \u0026#39;-installed.Rdata\u0026#39;))) ## Explore the list head(installed) ## [1] \u0026#34;abind\u0026#34; \u0026#34;acepack\u0026#34; \u0026#34;ada\u0026#34; \u0026#34;AER\u0026#34; \u0026#34;affy\u0026#34; \u0026#34;affyio\u0026#34; length(installed) ## [1] 611 Install latest R Ok, now you have a list of installed packages. It’s like a restore point. Next, you need to get the latest R installer for your OS from CRAN and install the latest R. For example, for a Mac that would be R-3.4.0.pkg. Install it as usual.\nRestore your packages By now you have a new R version installed but without all your favorite packages. So, how do you install them? You just need to open your latest list of installed packages and install them. Now, I’m a Bioconductor user which means that some of my packages are not on CRAN. But the following code will work for you even if all the packages you use are from CRAN.\n## Change accordingly list_dir \u0026lt;- \u0026#39;/Users/lcollado/Dropbox/Computing/R\u0026#39; ## Find the corresponding Rdata files previous \u0026lt;- dir(path = list_dir, pattern = \u0026#39;installed.Rdata\u0026#39;) ## Load the latest one load(file.path(list_dir, previous[length(previous)])) ## Just checking it head(installed) ## [1] \u0026#34;abind\u0026#34; \u0026#34;acepack\u0026#34; \u0026#34;ada\u0026#34; \u0026#34;AER\u0026#34; \u0026#34;affy\u0026#34; \u0026#34;affyio\u0026#34; Next, get the list of current R packages you have installed. Every new R installation comes with a few of them (the base packages). You don’t need to install those.\ncurrent \u0026lt;- dir(.libPaths()) Finally, install the missing packages\n## For Bioconductor and CRAN packages install.packages(\u0026#34;BiocManager\u0026#34;) BiocManager::install(installed[!installed %in% current]) and now you can continue on with your analysis 😄 You didn’t even need to figure out the best order to install the packages!\nGitHub packages Some of your favorite R packages might only exist via GitHub. This list is likely short since most packages get distributed via CRAN. But if that’s the case, you can see which packages are missing by running:\n## Check which packages are missing current_post_installation \u0026lt;- dir(.libPaths()) installed[!installed %in% current_post_installation] For example, in my case I use the colorout package which lives only in GitHub. I have to install that one manually:\ninstall.packages(\u0026#39;devtools\u0026#39;) library(\u0026#39;devtools\u0026#39;) install_github(\u0026#34;jalvesaq/colorout\u0026#34;) Other times a package might not be compiling for the new R version or might no longer be supported (defunct).\nMisc for Bioconductor developers If you are a Bioconductor developer or are planning on becoming one, then you need 2 versions of R at all times. One R for the bioc-release branch and another one for the bioc-devel branch. Sometimes it’s the same R version sometimes it’s not depending on the month of the year. Right now, Bioc-release (3.5) uses R 3.4.0 and Bioc-devel (3.6) also uses R 3.4.0. R Switch for Mac users will be your friend. I can’t find the old bioc-devel mailing list thread where I first learned this, but the idea is to download the latest R tar ball, change the name from 3.4 to something else (3.4devel in my case), put it back together into a tar ball and then use this tar ball to install a second R version.\n## Download latest R tarball wget http://r.research.att.com/el-capitan/R-3.4-branch/R-3.4-branch-el-capitan-sa-x86_64.tar.gz ## Un-tar it tar -xvf R-3.4-branch-el-capitan-sa-x86_64.tar.gz ## Renamed files from 3.4 to 3.4 devel mv Library/Frameworks/R.framework/Versions/3.4 Library/Frameworks/R.framework/Versions/3.4devel ## Put it back in a tar ball tar -cvzf Rlib.tgz Library ## Install it sudo tar fvxz Rlib.tgz -C / There you go:\nReproducibility ## Reproducibility info library(\u0026#39;devtools\u0026#39;) options(width = 120) session_info() ## Session info ----------------------------------------------------------------------------------------------------------- ## setting value ## version R version 3.4.0 (2017-04-21) ## system x86_64, darwin15.6.0 ## ui X11 ## language (EN) ## collate en_US.UTF-8 ## tz America/New_York ## date 2017-05-04 ## Packages --------------------------------------------------------------------------------------------------------------- ## package * version date …","date":1493856000,"expirydate":-62135596800,"kind":"page","lang":"en","lastmod":1741387162,"objectID":"2c44bd45b984e09e4f009b26bbae3d3a","permalink":"https://lcolladotor.github.io/2017/05/04/updating-r/","publishdate":"2017-05-04T00:00:00Z","relpermalink":"/2017/05/04/updating-r/","section":"post","summary":"As you might know by now, the latest R version was recently released (R 3.4.0). That means that you are highly encouraged to update your R installation. There are several ways to do this some of which are documented in these other blog posts: Tal Galili, 2013, Kris Eberwein, 2015.","tags":["Bioconductor","Help"],"title":"Updating R","type":"post"},{"authors":["[__L Collado-Torres__](/authors/admin) __*__","A Nellore __*__","K Kammers","SE Ellis","MA Taub","KD Hansen","AE Jaffe","B Langmead","JT Leek"],"categories":null,"content":" Interested in public human #RNAseq data from over 70,000 samples? Check out the recount2 paper published today!! https://t.co/AeOqy0WOK1\n— 🇲🇽 Leonardo Collado-Torres (@lcolladotor) April 11, 2017 ","date":1491947143,"expirydate":-62135596800,"kind":"page","lang":"en","lastmod":1651425968,"objectID":"71c517a36bd048b1e11d6c0d7a8e5e72","permalink":"https://lcolladotor.github.io/publication/2017-04_recount/","publishdate":"2017-04-11T16:45:43-05:00","relpermalink":"/publication/2017-04_recount/","section":"publication","summary":"recount2 is a resource of processed and summarized expression data spanning over 70,000 human RNA-seq samples from the Sequence Read Archive (SRA). The associated recount Bioconductor package provides a convenient API for querying, downloading, and analyzing the data. Each processed study consists of meta/phenotype data, the expression levels of genes and their underlying exons and splice junctions, and corresponding genomic annotation. We also provide data summarization types for quantifying novel transcribed sequence including base-resolution coverage and potentially unannotated splice junctions. We present workflows illustrating how to use recount to perform differential expression analysis including meta-analysis, annotation-free base-level analysis, and replication of smaller studies using data from larger studies. recount provides a valuable and user-friendly resource of processed RNA-seq datasets to draw additional biological insights from existing public data. The resource is available at https://jhubiostatistics.shinyapps.io/recount/.","tags":["recount2"],"title":"Reproducible RNA-seq analysis using recount2","type":"publication"},{"authors":null,"categories":["rstats"],"content":" tl;dr Please post your question at the Bioconductor support website https://support.bioconductor.org/ and check the posting guide http://www.bioconductor.org/help/support/posting-guide/. It’s important that you provide reproducible code and information about your R session. Recently I have been getting more questions about several packages I maintain. It’s great to see more interest from users, but at the same time most questions lack the information I need to help the users. I have also gotten most of the questions via email, which is why I am writing this post. As of today, I will no longer answer questions related to my Bioconductor packages via personal emails. This might sound harsh, but hopefully the rest of this post will convince you that it’s the best thing to do. You might also be interested in the basics of using derfinder, regionReport or recount, among others.\nThe Bioconductor project is a community project and it benefits from users interacting in public venues. When a user asks a question at the Bioconductor support website, they are providing information that future users might be interested in. That is, the user (U1) is contributing information to the overall documentation around the Bioconductor package they are asking a question about. Ideally, a new user (U2) can then read through the question U1 wrote, check the solution, and move on. This is one of the main reasons why we (developers) want questions to be well documented. There are a couple of quick things that U1 can check that will make their question much more useful to the community.\nSession information One of the strengths of Bioconductor is that all the packages have vignettes and lots of documentation. The packages are also checked regularly and must pass some tests. That also means that packages can change frequently, at least more frequently than CRAN packages. There’s also the added complexity that at any given point in time there is a release branch and a development branch. This means that there are many variables and saying that you are using the “latest version” doesn’t mean much to the developer. All of this information and more is part of the R session information. That is why I and others request users to post their session information. It’s very easy to get, simply run the following code:\n## Install devtools if needed # install.packages(\u0026#39;devtools\u0026#39;) ## Reproducibility info library(\u0026#39;devtools\u0026#39;) options(width = 120) session_info() The output might be too long to post in the Bioconductor support website. The easy solution is to save the information you want displayed in a gist. Then simply add the gist link in your question. Note that you need to have the link under “text” formatting and not “code”.\nCode to reproduce the error If U1 includes the session information, their question will be pretty good, but not ideal yet. Many of the questions I’ve been asked do not include code for me to figure out the exact steps of what they were doing. A lot of times I can infer pieces of what they were doing from their description of the problem. But doing so takes quite a bit of my time and effort, and is still not perfect. Now imagine that U2 is reading through the question: they would probably get lost!\nThere is a wide range of things that U1 could have done. To help the developer, the best thing is for the user to include the code that lead to the error. The code should include how the data was loaded, so that the developer can run it themselves and check in more detail what went wrong. This means providing a small subset of the data or using some publicly available data.\nI realize that writing code that reproduces the error is not easy. But it helps a lot for learning more about R and Bioconductor. I can tell you that I went through the same process, and in my experience you can find out what you are doing wrong by writing the reproducible code.\nExtra Here are some other tips that are useful.\nIf you run traceback() immediately after getting the error and include the output in your question, that would be great. It makes it easier to check at what point the code failed and produced the error. Recently when I ask questions myself, I include the “non-evaluated code” (clean code in your script) and “evaluated code” (think of the R console: a mix of code and output). The non-evaluated code makes it easier for others to copy-paste the code into their R session without having to deal with any formatting issues (example). If you encounter a new error, post a new question instead of “replying” to the first one. Introduce yourself. Be polite. By now you should be ready to post some great questions! Thanks for contributing to the Bioconductor community.\nWant more? Check other @jhubiostat student and alumni blogs at Bmore Biostats as well as topics on #rstats.\n","date":1488758400,"expirydate":-62135596800,"kind":"page","lang":"en","lastmod":1651362355,"objectID":"72b25f1ed697ee0c7cc67a54da86e952","permalink":"https://lcolladotor.github.io/2017/03/06/how-to-ask-for-help-for-bioconductor-packages/","publishdate":"2017-03-06T00:00:00Z","relpermalink":"/2017/03/06/how-to-ask-for-help-for-bioconductor-packages/","section":"post","summary":"tl;dr Please post your question at the Bioconductor support website https://support.bioconductor.org/ and check the posting guide http://www.bioconductor.org/help/support/posting-guide/. It’s important that you provide reproducible code and information about your R session.","tags":["Help"],"title":"How to ask for help for Bioconductor packages","type":"post"},{"authors":null,"categories":["Ideas"],"content":" tl;dr There is a 600 million to 2 billion USD annual market related to crossing the Mexico-US border. Allow temporary work visas (say 3 years) to take over this market and use the money to boost the US Border Patrol to build a wall of eyes, not a physical wall. President Trump of the United States of America,\ncc President Peña Nieto of the United Mexican States\nToday, Wednesday January 25th 2017, you are expected to announce your plans about building a wall between the United States and Mexico. I am opposed to building that wall but I also believe that providing alternatives is important when disagreeing. With that in mind, let me expose an alternative to your physical wall.\nMexico has a net immigration rate of -1.7 migrants per 1,000 and a population of 123,166,749 individuals1 which means that about 209,000 people leave Mexico every year. The Department of Homeland Security 2014 report2 shows that 350,177 out of 679,996 (51%) total aliens apprehended are from Mexico (52% reported elsewhere3,4). Many of the illegal immigrants pay people for helping them cross the Mexico-US border also known as coyotes. Some informal surveys put the cost of a coyote between 3,000 and 20,000 US dollars5,6. That means that there is an annual market worth about 627 to 1,050 million US dollars. This market exists and has been steady for years now. A physical wall in the Mexico-US border might not stop the illegal immigration to the US. Loss of jobs in Mexico directly related to your policies might even prompt more people to leave Mexico7. I believe that the high volume of people crossing the Mexico-US border makes it easier for drug cartels to hide and transport drugs. That is, it makes it harder for the US Border Patrol Agents to find who is transporting drugs and the track down the routes they use.\nSo, what if the US took over this multi million dollar market? I have had the opportunity to visit countries that offer temporary work visas (ranging from 6 months to 3 years). The people interested in these visas have to pay a fee, pass a background check and sometimes go through health screenings. I believe that these immigrants pay the fee because it allows them to legally migrate, work for a while, save some money, and then go back to their home countries. From an immigrant’s perspective, it must be very appealing to pay the same amount of money it cost to migrate safely and legally (for temporary work) than to attempt to cross the border illegally with the risk of dying in the process or getting kidnapped. Additionally, I think that temporary workers would feel much safer to go out of their homes while in the US, spending some of their hard earned money in the process and stimulating the local economy. They would be more likely to get a regular job where they would pay income taxes instead of getting payed under the table and dodging the IRS. Furthermore, having the opportunity to legally go back home and visit family would be a huge advantage from an immigrant’s perspective.\nWhile writing this letter I realized that the idea of immigration tariffs is not new8,9,10,11. However, I have not heard it being discussed recently and simply ask that you consider it.\nTo try to convince you that immigration tariffs are an interesting alternative, consider what your government could do with an additional 600 to 1,000 million US dollars a year – or multiply those numbers by two to get 1.2 to 2 billions USD a year by taking into account that about 50% of illegal immigrants are Mexicans. The average Border Patrol Agent self-reported salary is 80,250 USD a year12. The actual salaries range from 21,616 to 157,257 USD as of January 201713 depending on the grade and level as well as other options14. In 2016, there were nearly 20,000 border patrol agents in the US15. That means that you could decide to increase the number of Border Patrol Agents by 10,000 (50%) for about 803 million USD or increase the number of Agents by 5,000 while increasing their salaries by 10% for about 602 million USD. Why do I bring up the number of Agents? Because that would mean that you are building a wall of eyes in the Mexico-US border. I believe that under this scenario, you and your public relations team could convince your supporters that you delivered on your campaign promise of building a wall. It would just be a different kind of wall. The extra Border Patrol Agents and/or happier Agents (due to their increased salary) along with fewer attempts to cross the border (because immigrants would be interested in paying the immigration tariff) would make them more efficient in their jobs. Some of them could be dedicated to making sure no one overstays their temporary work visa. Also note that by law, you have to be a US citizen to become a Border Patrol Agent16, so you would be increasing US jobs by 5 to 10 thousand under this scenario. That is more than the 700 jobs you claim to have saved from moving to Mexico from the US by cancelling the plans to build a factory …","date":1485309600,"expirydate":-62135596800,"kind":"page","lang":"en","lastmod":1651362355,"objectID":"898216f72be098a788b609b35a3832b7","permalink":"https://lcolladotor.github.io/2017/01/25/an-alternative-to-the-mexico-us-wall-where-the-us-would-gain-millions-of-dollars/","publishdate":"2017-01-25T02:00:00Z","relpermalink":"/2017/01/25/an-alternative-to-the-mexico-us-wall-where-the-us-would-gain-millions-of-dollars/","section":"post","summary":"tl;dr There is a 600 million to 2 billion USD annual market related to crossing the Mexico-US border. Allow temporary work visas (say 3 years) to take over this market and use the money to boost the US Border Patrol to build a wall of eyes, not a physical wall.","tags":["politics"],"title":"An alternative to the Mexico-US wall where the US would gain millions of dollars","type":"post"},{"authors":null,"categories":["rstats","LIBD"],"content":"Have you ever had to explore a table with data? I believe the answer is yes for most people that work at a computer or even just use it for communicating with their friends and family. Tables of data pop up everywhere, for example in personal finance. Websites like Mint.com allow you to download your transactions in a CSV file called transactions.csv. CSV is one of the many formats for storing tables and most likely when you try to open the transactions.csv file, it will open with Excel. Now, can you make a quick figure of one of your columns in your table?\nSome will answer yes, others no. The basic issue is that it’s not super easy to explore your data in Excel or similar programs. Wait, shouldn’t it be easy? 😕\nWhat if you want to subset your data and want to re-make the plot? How about getting some simple statistics like the mean or frequency of some categories for a given variable? 😨 These are some of the immediate tasks that are helpful when exploring data. Visually, making figures with two variables is also very common.\nProgrammers and experts in Excel, Stata, R among other options can perform these data explorations. It might take them a little bit of time to write the code or remember it or use the user interface menu of their program of choice. But what about everyone else?\nAt the Lieber Institute for Brain Development where I work, it’s common for us to exchange data in tables, and thus explore data. That’s why we created shinycsv (Collado-Torres, Semick, and Jaffe, 2016). It’s an R package (R Core Team, 2016) that contains a shiny (Chang, Cheng, Allaire, Xie, et al., 2017) application that allows users to interactively explore a table.\nInstalling R is a pretty high bar, that’s why we are hosting this application at https://jhubiostatistics.shinyapps.io/shinycsv/. Try it out!\nshinycsv application The application includes data about cars to demonstrate what it can do. It’s a small data set that is commonly used for demonstration purposes. Anyhow, in the application you’ll notice a few tabs.\nThe application shows the raw data in an interactive table that allows you to subset the observations by some criteria, search in the table, and sort in different ways. The raw summary tab shows quick statistical summaries which depend on the variable type (numerical, categorical, etc). If you interacted with the table in raw data then the summaries at raw summary will be based on the subset you selected.\nThe one variable and two variables tabs are for making figures based on one or two variables at a time. The code in shinycsv tries to guess what’s the best figure for a given type of variable and in case that you are interested in learning R, it also shows the exact code you can use to reproduce the figure in your computer. We added this feature to excite users about learning R. And it’s useful for advanced users too that might want to customize the resulting figures. Hm…, you don’t like the colors we chose for the figure? Well go to plot colors, choose another color, and come back to see your new figure with the color of your choosing. 😄\nHm… but what if you don’t have a CSV file? Well, shinycsv can handle many different tables thanks to rio (Chan, Chan, Leeper, and Becker, 2016). Even Excel sheets! 😉\nSo, go ahead and test it out! We’ll be glad to hear your feedback at LieberInstitute/shinycsv.\nNotes Note that when I referred to tables earlier, I referred to square tables with different variables (age, height, weight, etc) as columns as observations as rows. That is, Excel files with a single sheet with no comments or figures inside the Excel file. Are you interested in learning more about R and shiny? Maybe you’ll want to take a look at the showcase mode version of the application. If you use shinycsv::explore() locally, the file size limit is increased to 500 MB. Although at that point you might want to consider using R or another programming language. What about casting variables? If you want to have fine control about casting the variables, save your data in a RData file. Sure, this requires an R user. Reproducibility ## Reproducibility info library(\u0026#39;devtools\u0026#39;) options(width = 120) session_info() ## Session info ----------------------------------------------------------------------------------------------------------- ## setting value ## version R Under development (unstable) (2016-10-26 r71594) ## system x86_64, darwin13.4.0 ## ui X11 ## language (EN) ## collate en_US.UTF-8 ## tz America/New_York ## date 2017-01-20 ## Packages --------------------------------------------------------------------------------------------------------------- ## package * version date source ## bibtex 0.4.0 2014-12-31 CRAN (R 3.4.0) ## bitops 1.0-6 2013-08-17 CRAN (R 3.4.0) ## devtools * 1.12.0 2016-12-05 CRAN (R 3.4.0) ## digest 0.6.11 2017-01-03 CRAN (R 3.4.0) ## evaluate 0.10 2016-10-11 CRAN (R 3.4.0) ## httr 1.2.1 2016-07-03 CRAN (R 3.4.0) ## knitcitations * 1.0.7 2015-10-28 CRAN (R 3.4.0) ## knitr * 1.15.1 2016-11-22 CRAN (R …","date":1484870400,"expirydate":-62135596800,"kind":"page","lang":"en","lastmod":1485180400,"objectID":"e44c274c4fadb9c44d22cdcf9ddfd703","permalink":"https://lcolladotor.github.io/2017/01/20/easily-explore-a-table-with-shinycsv/","publishdate":"2017-01-20T00:00:00Z","relpermalink":"/2017/01/20/easily-explore-a-table-with-shinycsv/","section":"post","summary":"Have you ever had to explore a table with data? I believe the answer is yes for most people that work at a computer or even just use it for communicating with their friends and family.","tags":["shiny","table"],"title":"Easily explore a table with shinycsv","type":"post"},{"authors":["A Nellore","AE Jaffe","JP Fortin","J Alquicira-Hernández","[__L Collado-Torres__](/authors/admin)","S Wang","RA Phillips","N Karbhari","KD Hansen","B Langmead","JT Leek"],"categories":null,"content":" Human splicing diversity across the Sequence Read Archive https://t.co/wOX5U0Uenm #bioRxiv\n— bioRxiv (@biorxivpreprint) January 30, 2016 ","date":1483137889,"expirydate":-62135596800,"kind":"page","lang":"en","lastmod":1651425968,"objectID":"5158b044ce7f126ed8e48be5a085e61d","permalink":"https://lcolladotor.github.io/publication/2016-12_intropolis/","publishdate":"2016-12-30T17:44:49-05:00","relpermalink":"/publication/2016-12_intropolis/","section":"publication","summary":"We found 56,861 junctions (18.6%) in at least 1000 samples that were not annotated out of 21,504 samples, and their expression associated with tissue type. We compiled junction data into a resource called intropolis available at http://intropolis.rail.bio.","tags":["recount2","Rail-RNA"],"title":"Human splicing diversity and the extent of unannotated splice junctions across human RNA-seq samples on the Sequence Read Archive","type":"publication"},{"authors":["Leonardo Collado-Torres"],"categories":null,"content":" ","date":1482741000,"expirydate":-62135596800,"kind":"page","lang":"en","lastmod":1621020950,"objectID":"4873435926103ff55fdea70d6213cd09","permalink":"https://lcolladotor.github.io/talk/kandahar2016/","publishdate":"2016-12-26T08:30:00Z","relpermalink":"/talk/kandahar2016/","section":"talk","summary":"Introduction of my work to kick off the epidemiology and biostatistics training for Kandahar University MPH faculty.","tags":["recount2","derfinder"],"title":"Introduction at Kandahar University MPH training event","type":"talk"},{"authors":["Leonardo Collado-Torres"],"categories":null,"content":" ","date":1477440000,"expirydate":-62135596800,"kind":"page","lang":"en","lastmod":1621020950,"objectID":"24efc73f3cfa2a2a4d12af8b02663047","permalink":"https://lcolladotor.github.io/talk/genomeeting2016/","publishdate":"2016-10-26T00:00:00Z","relpermalink":"/talk/genomeeting2016/","section":"talk","summary":"Desde que es derfinder hasta como se puede usar con recount2","tags":["recount2","derfinder"],"title":"recount: facilitando el análisis de miles de muestras de RNA-seq","type":"talk"},{"authors":["Leonardo Collado-Torres"],"categories":null,"content":" ","date":1476489600,"expirydate":-62135596800,"kind":"page","lang":"en","lastmod":1621020950,"objectID":"96e889cdab7cd6422d87307248629c93","permalink":"https://lcolladotor.github.io/talk/sacnas2016/","publishdate":"2016-10-15T00:00:00Z","relpermalink":"/talk/sacnas2016/","section":"talk","summary":"Motivating SACNAS2016 attendees to pursue a career in STEM by showcasing my research","tags":["recount2","derfinder"],"title":"Using Data Science to Study Human Brain Genomic Measurements","type":"talk"},{"authors":["[__L Collado-Torres__](/authors/admin)","A Nellore","AC Frazee","C Wilks","MI Love","B Langmead","RA Irizarry","JT Leek","AE Jaffe"],"categories":null,"content":" New preprint on derfinder software out! Congrats @fellgernon http://t.co/HTkm2HbNxS. Also check the software: http://t.co/CuEdxaYdyM\n— Jeff Leek (@jtleek) February 19, 2015 ","date":1474848000,"expirydate":-62135596800,"kind":"page","lang":"en","lastmod":1651425968,"objectID":"27840c9d6177b4321868cdc431ba8ecf","permalink":"https://lcolladotor.github.io/publication/2016-09_derfinder/","publishdate":"2016-09-26T00:00:00Z","relpermalink":"/publication/2016-09_derfinder/","section":"publication","summary":"derfinder analysis using expressed region-level and single base-level approaches provides a compromise between full transcript reconstruction and feature-level analysis. The package is available from Bioconductor.","tags":["derfinder"],"title":"Flexible expressed region analysis for RNA-seq with derfinder","type":"publication"},{"authors":["A Nellore","[__L Collado-Torres__](/authors/admin)","AE Jaffe"," J Alquicira-Hernández","C Wilks","J Pritt","J Morton","JT Leek","B Langmead"],"categories":null,"content":" Rail-RNA scalable analysis of splicing \u0026amp; coverage out in Bioinformatics! https://t.co/dPjXp1kL2p great work @AbhiNellore @BenLangmead!\n— Jeff Leek (@jtleek) September 6, 2016 ","date":1472941675,"expirydate":-62135596800,"kind":"page","lang":"en","lastmod":1651425968,"objectID":"770b43dc7647f29f0078ebe1c0f07733","permalink":"https://lcolladotor.github.io/publication/2016-09_rail/","publishdate":"2016-09-03T17:27:55-05:00","relpermalink":"/publication/2016-09_rail/","section":"publication","summary":"We describe Rail-RNA, a cloud-enabled spliced aligner that analyzes many samples at once. Rail-RNA eliminates redundant work across samples, making it more efficient as samples are added. For many samples, Rail-RNA is more accurate than annotation-assisted aligners.","tags":["Rail-RNA","derfinder"],"title":"Rail-RNA: Scalable analysis of RNA-seq splicing and coverage","type":"publication"},{"authors":null,"categories":["rstats","UNAM"],"content":"Over the weekend my brother wanted to figure out his class schedule for the next semester. He is a veterinary medicine and zootechnology student at UNAM. For this upcoming semester there is a set of classes he has to take and each has 8 or so instructor options. The website where he finds the class times lists about 8 pre-constructed class schedules. So he normally finds one he likes quite a bit, and then manually starts checking if he can change X instructor for Y for a given class. He does this based on the referalls and information he has gathered about the instructors, plus he factors in whether it’d be an overall better schedule. For example, he might prefer to have a packed Tuesday if that means that he can leave early on Friday and avoid classes on Saturday.\nThe problem is that it’s very easy to make a mistake. You (well he) gets all excited thinking that he’s found the perfect schedule. Only to then realize that there is a conflict between two classes. Or that the practical portion of a class is in a location one hour away from the university, meaning that the schedule he has selected won’t work. This process is very frustrating.\nI was watching him and I started to think if I could help him with some code. Turns out that it was straightforward to write some code to find which options are valid. Once I wrote a test case, it took us like half an hour to fill out the data. I know that tomorrow is when he and his classmates start registering for classes, so this information might help his classmates.\nFirst, I define some helper functions. These are rather straightforward but I’ll be using them later on. For example, dias() is just there for typing less.\n## Helper functions dias \u0026lt;- function(d, i) { paste0(d, i) } extract \u0026lt;- function(m, p) { m[[p]] } extract_names \u0026lt;- function(m, p) { names(m)[p] } Next comes the input information. I organized it in a set of nested list objects. The schedule is stored as a character vector. For example, Lucia Eliana’s class meets on Wednesdays (__M__iercoles in Spanish) from 9 to 11 am. I only keep the starting hours (9 and 10 am) because otherwise the code won’t detect valid opitons that include another class that starts at 11 am. For classes that are 1 hour away from the university, we included 1 hour before and 1 hour after the class.\n## Input class/prof info and schedule materias \u0026lt;- list( repro = list( \u0026#39;lucia eliana\u0026#39; = c(dias(\u0026#39;m\u0026#39;, 9:10), dias(\u0026#39;j\u0026#39;, 9:10), dias(\u0026#39;v\u0026#39;, 8:13)), \u0026#39;esquivel lacroix\u0026#39; = c(dias(\u0026#39;l\u0026#39;, 14:15), dias(\u0026#39;ma\u0026#39;, 12:18), dias(\u0026#39;m\u0026#39;, 14:15)), \u0026#39;ismael porras\u0026#39; = c(dias(\u0026#39;l\u0026#39;, 9:10), dias(\u0026#39;m\u0026#39;, 8:14), dias(\u0026#39;j\u0026#39;, 9:10)), \u0026#39;esquivel lacroix 2\u0026#39; = c(dias(\u0026#39;l\u0026#39;, 14:15), dias(\u0026#39;m\u0026#39;, 14:15), dias(\u0026#39;v\u0026#39;, 12:18)), \u0026#39;salvador galina\u0026#39; = c(dias(\u0026#39;ma\u0026#39;, 8:13), dias(\u0026#39;j\u0026#39;, 9:10), dias(\u0026#39;v\u0026#39;, 9:10)), \u0026#39;alberto balcazar\u0026#39; = c(dias(\u0026#39;l\u0026#39;, 15:16), dias(\u0026#39;j\u0026#39;, 12:18), dias(\u0026#39;v\u0026#39;, 14:15)), \u0026#39;ana myriam boeta\u0026#39; = c(dias(\u0026#39;l\u0026#39;, 8:13), dias(\u0026#39;m\u0026#39;, 10:11), dias(\u0026#39;v\u0026#39;, 9:10)), \u0026#39;rafael eduardo paz\u0026#39; = c(dias(\u0026#39;l\u0026#39;, 11:17), dias(\u0026#39;j\u0026#39;, 14:15), dias(\u0026#39;v\u0026#39;, 16:17)), \u0026#39;juan heberth\u0026#39; = c(dias(\u0026#39;ma\u0026#39;, 9:10), dias(\u0026#39;m\u0026#39;, 11:17), dias(\u0026#39;v\u0026#39;, 11:12)), \u0026#39;vicente octavio mejia\u0026#39; = c(dias(\u0026#39;ma\u0026#39;, 8:17)) ), economia = list( \u0026#39;valentin efren espinoza\u0026#39; = c(dias(\u0026#39;l\u0026#39;, 8:10), dias(\u0026#39;ma\u0026#39;, 9:11)), \u0026#39;maria del pilar velazquez\u0026#39; = c(dias(\u0026#39;l\u0026#39;, 16:18), dias(\u0026#39;m\u0026#39;, 16:18)), \u0026#39;arturo alonso pesado\u0026#39; = c(dias(\u0026#39;l\u0026#39;, 11:13), dias(\u0026#39;j\u0026#39;, 11:13)), \u0026#39;laura mendez\u0026#39; = c(dias(\u0026#39;ma\u0026#39;, 13:15), dias(\u0026#39;m\u0026#39;, 18:20)), \u0026#39;laura mendez 2\u0026#39; = c(dias(\u0026#39;j\u0026#39;, 11:13), dias(\u0026#39;v\u0026#39;, 11:13)), \u0026#39;manuela garcia\u0026#39; = c(dias(\u0026#39;l\u0026#39;, 17:19), dias(\u0026#39;v\u0026#39;, 16:18)), \u0026#39;francisco alejandro\u0026#39; = c(dias(\u0026#39;ma\u0026#39;, 7:9), dias(\u0026#39;j\u0026#39;, 7:9)), \u0026#39;isaac reyes\u0026#39; = c(dias(\u0026#39;m\u0026#39;, 13:15), dias(\u0026#39;v\u0026#39;, 13:15)), \u0026#39;jose luis tinoco\u0026#39; = c(dias(\u0026#39;ma\u0026#39;, 12:14), dias(\u0026#39;m\u0026#39;, 9:11)), \u0026#39;isaac reyes 2\u0026#39; = c(dias(\u0026#39;l\u0026#39;, 14:16), dias(\u0026#39;ma\u0026#39;, 14:16)) ), bacterianas = list( \u0026#39;jose luis gutierrez\u0026#39; = dias(\u0026#39;s\u0026#39;, 8:11), \u0026#39;rodrigo mena\u0026#39; = c(dias(\u0026#39;ma\u0026#39;, 18:19), dias(\u0026#39;j\u0026#39;, 18:19)), \u0026#39;beatriz arellano\u0026#39; = c(dias(\u0026#39;l\u0026#39;, 7:8), dias(\u0026#39;ma\u0026#39;, 10:11)), \u0026#39;de la pena, ramirez ortega\u0026#39; = c(dias(\u0026#39;j\u0026#39;, 18:19), dias(\u0026#39;v\u0026#39;, 18:19)), \u0026#39;ramirez ortega\u0026#39; = c(dias(\u0026#39;m\u0026#39;, 7:8), dias(\u0026#39;j\u0026#39;, 7:8)), \u0026#39;rodrigo mena 2\u0026#39; = c(dias(\u0026#39;ma\u0026#39;, 16:17), dias(\u0026#39;m\u0026#39;, 16:17)), \u0026#39;de la pena\u0026#39; = dias(\u0026#39;s\u0026#39;, 8:11), \u0026#39;efren diaz aparicio\u0026#39; = dias(\u0026#39;s\u0026#39;, 8:11), \u0026#39;lucia del carmen favila\u0026#39; = dias(\u0026#39;s\u0026#39;, 8:11) ), parasitarias = list( \u0026#39;cintli martinez\u0026#39; = c(dias(\u0026#39;j\u0026#39;, 16:17), dias(\u0026#39;v\u0026#39;, 18:20)), \u0026#39;osvaldo froylan\u0026#39; = c(dias(\u0026#39;ma\u0026#39;, 18:19), dias(\u0026#39;j\u0026#39;, 18:20)), \u0026#39;maria quintero, agustin perez\u0026#39; = c(dias(\u0026#39;ma\u0026#39;, 13:14), dias(\u0026#39;m\u0026#39;, 7:9)), \u0026#39;maria quintero\u0026#39; = c(dias(\u0026#39;m\u0026#39;, 16:18), dias(\u0026#39;j\u0026#39;, 16:17)), \u0026#39;evangelina romero\u0026#39; = c(dias(\u0026#39;ma\u0026#39;, 7:8), dias(\u0026#39;v\u0026#39;, 7:9)), \u0026#39;guadarrama 01\u0026#39; = c(dias(\u0026#39;m\u0026#39;, 7:8), dias(\u0026#39;j\u0026#39;, 11:13)), \u0026#39;guadarrama 03\u0026#39; = c(dias(\u0026#39;ma\u0026#39;, 13:15), dias(\u0026#39;v\u0026#39;, 7:8)), \u0026#39;guadarrama 04\u0026#39; = c(dias(\u0026#39;l\u0026#39;, 16:17), dias(\u0026#39;ma\u0026#39;, 18:20)), \u0026#39;guadarrama 05\u0026#39; = c(dias(\u0026#39;l\u0026#39;, 7:9), dias(\u0026#39;j\u0026#39;, 7:8)) ), diagnosticas = list( \u0026#39;1701\u0026#39; = c(dias(\u0026#39;l\u0026#39;, 11:13), dias(\u0026#39;m\u0026#39;, 11:16)), \u0026#39;1702\u0026#39; = c(dias(\u0026#39;j\u0026#39;, 13:15), dias(\u0026#39;v\u0026#39;, 13:18)), \u0026#39;1703\u0026#39; = c(dias(\u0026#39;ma\u0026#39;, 7:9), dias(\u0026#39;v\u0026#39;, 8:13)), \u0026#39;1704\u0026#39; = c(dias(\u0026#39;l\u0026#39;, 18:20), dias(\u0026#39;j\u0026#39;, 13:18)), \u0026#39;1705\u0026#39; = …","date":1470096000,"expirydate":-62135596800,"kind":"page","lang":"en","lastmod":1741387190,"objectID":"5486c3b8d6513d2d1ba53893678dfef7","permalink":"https://lcolladotor.github.io/2016/08/02/finding-possible-class-schedules/","publishdate":"2016-08-02T00:00:00Z","relpermalink":"/2016/08/02/finding-possible-class-schedules/","section":"post","summary":"Over the weekend my brother wanted to figure out his class schedule for the next semester. He is a veterinary medicine and zootechnology student at UNAM. For this upcoming semester there is a set of classes he has to take and each has 8 or so instructor options.","tags":["shiny"],"title":"Finding possible class schedules","type":"post"},{"authors":["[__L Collado-Torres__](/authors/admin)","AE Jaffe","JT Leek"],"categories":null,"content":" Checkout @fellgernon\u0026#39;s regionReport http://t.co/d4WUytrPnD (code: http://t.co/q46d4RKlYC) for best results, pair w/derfinder, bumphunter ...\n— Jeff Leek (@jtleek) March 17, 2015 ","date":1467238918,"expirydate":-62135596800,"kind":"page","lang":"en","lastmod":1651425968,"objectID":"63da30a312ceb70e49fe33f477d39eea","permalink":"https://lcolladotor.github.io/publication/2016-06_regionreport/","publishdate":"2016-06-29T17:21:58-05:00","relpermalink":"/publication/2016-06_regionreport/","section":"publication","summary":"regionReport is an R package for generating detailed interactive reports from region-level genomic analyses as well as feature-level RNA-seq. The report includes quality-control checks, an overview of the results, an interactive table of the genomic regions or features of interest and reproducibility information. regionReport provides specialised reports for exploring DESeq2, edgeR, or derfinder differential expression analyses results. regionReport is also flexible and can easily be expanded with report templates for other analysis pipelines.","tags":["regionReport"],"title":"regionReport: Interactive reports for region-level and feature-level genomic analyses","type":"publication"},{"authors":["Leonardo Collado-Torres"],"categories":null,"content":" ","date":1466380800,"expirydate":-62135596800,"kind":"page","lang":"en","lastmod":1621020950,"objectID":"b789530830407db515c3e4b2a4b2dba8","permalink":"https://lcolladotor.github.io/talk/defense2016/","publishdate":"2016-06-20T00:00:00Z","relpermalink":"/talk/defense2016/","section":"talk","summary":"L. Collado-Torres's Johns Hopkins Bloomberg School of Public Health, Department of Biostatistics Ph.D. defense talk","tags":["derfinder","dbFinder","recount2","Favorite"],"title":"Annotation-agnostic differential expression and binding analyses","type":"talk"},{"authors":null,"categories":null,"content":"In 2015 we re-processed all the human RNA-seq that was publicly available at the time in an effort to improve the usability of this complex type of data and to facilitate developing new bioinformatic and biostatistical methods. Via recount2 we have democratized the access to this rich data and this project has lead to many different publications by the recount2 team and other researchers.\n","date":1466380800,"expirydate":-62135596800,"kind":"page","lang":"en","lastmod":1683606876,"objectID":"35a6107ae4fff1e24350a39a8317819f","permalink":"https://lcolladotor.github.io/project/recount2/","publishdate":"2016-06-20T00:00:00Z","relpermalink":"/project/recount2/","section":"project","summary":"Uniform processing of human RNA-seq data to improve usability and power methods development","tags":["recount2","bulk"],"title":"recount2","type":"project"},{"authors":null,"categories":["UNAM"],"content":" Today the UNAM community at large mourns the passing of Federico Sánchez Rodríguez. He got his bachelor’s degree from the School of Chemistry - UNAM, masters and PhD degrees from Biomedicas - UNAM, postdoc from UCSF, was a member of CIFN-UNAM now called CCG-UNAM (it’s his affiliation in this 1983 paper), and worked most of his career at IBT-UNAM.\nI’m sure that he made many friends, trained many students at all levels, and had a highly productive academic career as evidenced on his homepage where he lists many papers, patents, etc. A PubMed author search includes his papers but be careful to not confuse him with other authors that shared his name.\nI’ll remember Federico fondly for the time we shared at LCG-UNAM. He was a great teacher and motivated me to ask as many questions as I could think of. My background in biology was weaker than my classmates, and I loved to ask questions of the sort: if X biolgical process is possible, could Y happen in the cell? He let my imagination run wild. Federico was very supportive of an elective class a few of us organized in our 4th year. You could always tell that he fed off the energy of enthusiastic students. He was always there if you needed some advice. At the end of my time at LCG-UNAM, he enjoyed how I argued against other members of the LCG academic committee. He always supported me in my non-traditional choices. Federico knew many things about plants, but also about the best food, the best drinks, and was always eager to share his knowledge with you.\nIn one of my last interactions with him at FedeFest in August 2014, I asked him a question in the style that I used to during class. I asked him how would he evaluate results from single-cell sequencing and verify that the results were indeed biogical and not technical. A month later, I sent him this paper.\nFede, I will always remember you fondly.\nBest, Leonardo\nLCG-UNAM 2005-2009\n","date":1459728000,"expirydate":-62135596800,"kind":"page","lang":"en","lastmod":1741387190,"objectID":"ddb7abf6467ed587a566f5ffdef02399","permalink":"https://lcolladotor.github.io/2016/04/04/federico-sanchez-rodriguez-1950-2016/","publishdate":"2016-04-04T00:00:00Z","relpermalink":"/2016/04/04/federico-sanchez-rodriguez-1950-2016/","section":"post","summary":"Today the UNAM community at large mourns the passing of Federico Sánchez Rodríguez. He got his bachelor’s degree from the School of Chemistry - UNAM, masters and PhD degrees from Biomedicas - UNAM, postdoc from UCSF, was a member of CIFN-UNAM now called CCG-UNAM (it’s his affiliation in this 1983 paper), and worked most of his career at IBT-UNAM.","tags":["LCG"],"title":"Federico Sánchez Rodríguez 1950-2016","type":"post"},{"authors":null,"categories":["UNAM"],"content":"This has been a busy week. I just flew in last night from #ENAR2016 and I’m getting ready for a postdoc interview tomorrow, which means that I’m also flying today. On the flight back from #ENAR2016 I started reading a book my friend John Muschelli bought for me. It’s called The Happiness Advantage by Shawn Anchor and so far I’m loving it. There are several things that it talks about that I’ve done in the past, but maybe not in the past year. Anyhow, I’ll probably talk about it in a separate blog post.\nBut coincidentally, a friend of mine from undergrad just shared with me the following YouTube video. Watching it made me very happy! We definitely had a blast during undergrad. The person that talks about Boston is Frederick Bieber (he’s kinda hard to google due to his last name) who at the time worked with 5 of my classmates.\nMy undergrad class from LCG-UNAM (link is in English) was the 3rd one (yup, still guinea pigs) and the only one to start off with 40 students. Some left to study other degrees, most of us continue to work in academia getting our master’s, PhDs, postdocs done; others have chosen different career paths, and sadly one of us already passed away. But I bet we can all say that 2005-2009 were good and happy years.\nWant more? Check other @jhubiostat student blogs at Bmore Biostats as well as topics on #rstats.\n","date":1457568000,"expirydate":-62135596800,"kind":"page","lang":"en","lastmod":1741387190,"objectID":"88da73e2cadc41dfe4817aaccb92bf54","permalink":"https://lcolladotor.github.io/2016/03/10/lcg-unam-11-years-ago/","publishdate":"2016-03-10T00:00:00Z","relpermalink":"/2016/03/10/lcg-unam-11-years-ago/","section":"post","summary":"This has been a busy week. I just flew in last night from #ENAR2016 and I’m getting ready for a postdoc interview tomorrow, which means that I’m also flying today. On the flight back from #ENAR2016 I started reading a book my friend John Muschelli bought for me.","tags":["Fun","LCG","work-life"],"title":"LCG-UNAM 11 years ago","type":"post"},{"authors":["Leonardo Collado-Torres"],"categories":null,"content":" Annotation-agnostic differential expression analysis from lcolladotor ","date":1457308800,"expirydate":-62135596800,"kind":"page","lang":"en","lastmod":1621020950,"objectID":"128e6c317dacbfd5a4db0058fbffa050","permalink":"https://lcolladotor.github.io/talk/enar2016/","publishdate":"2016-03-07T00:00:00Z","relpermalink":"/talk/enar2016/","section":"talk","summary":"derfinder overview for ENAR2016","tags":["derfinder"],"title":"Annotation-agnostic differential expression analysis","type":"talk"},{"authors":null,"categories":["rstats"],"content":"It’s the morning of the first day of oral conferences at #ENAR2016. I feel like I have a spidey sense since I woke up 3 min after an email from Jeff Leek; just a funny coincidence. Anyhow, I promised Valerie Obenchain at #Bioc2014 that I would write a post about one of my favorite Bioconductor packages: BiocParallel (Morgan, Obenchain, Lang, and Thompson, 2016). By now it’s on the top 5% of downloaded Bioconductor packages, so many people know about it or are unaware that their favorite package uses it behind the scenes.\nWhile I haven’t blogged about BiocParallel yet, I did give a presentation about it at our computing club back in April 2nd, 2015. See it here (source). I’m going to follow its structure in this post.\nParallel computing Before even thinking about using BiocParallel you have to decide whether parallel computing is the thing you need.\nWhile I’m not talking about cloud computing, I still find this picture funny.\nThere’s different types of parallel computing, but what I’m referring to here is called embarrassingly parallel where you have a task to do for a set of inputs, you split your inputs into subsets and perform the task on these subsets. Performing this task for one input a a time is called serial programming and it’s what we do in most cases when using functions like lapply() or for loops.\nplot(y = 10 / (1:10), 1:10, xlab = \u0026#39;Number of cores\u0026#39;, ylab = \u0026#39;Time\u0026#39;, main = \u0026#39;Ideal scenario\u0026#39;, type = \u0026#39;o\u0026#39;, col = \u0026#39;blue\u0026#39;, cex = 2, cex.axis = 2, cex.lab = 1.5, cex.main = 2, pch = 16) You might be running a simulation for a different set of parameters (a parameter grid) and running each simulation could take some time. Parallel computing can help you speed up this problem. In the ideal scenario, the higher number of computing cores (units that evaluate subsets of your inputs) the less time you need to run your full analysis.\nplot(y = 10 / (1:10), 1:10, xlab = \u0026#39;Number of cores\u0026#39;, ylab = \u0026#39;Time\u0026#39;, main = \u0026#39;Reality\u0026#39;, type = \u0026#39;o\u0026#39;, col = \u0026#39;blue\u0026#39;, cex = 2, cex.axis = 2, cex.lab = 1.5, cex.main = 2, pch = 16) lines(y = 10 / (1:10) * c(1, 1.05^(2:10) ), 1:10, col = \u0026#39;red\u0026#39;, type = \u0026#39;o\u0026#39;, cex = 2) However, in reality parallel computing is not cost-free. It involves some communication costs, like sending the data to the cores, aggregating the results in a way that you can then easily use, among other things. So, it’ll be a bit slower than the ideal scenario but you can potentially still greatly reduce the overall time.\nHaving said all of the above, lets say that you now want to do some parallel computing in R. Where do you start? A pretty good place to start is the CRAN Task View: High-Performance and Parallel Computing with R. There you’ll find a lot of information about different packages that enable you to do parallel computing with R.\nBut you’ll soon be lost in a sea of new terms.\nWhy use BiocParallel? It’s simple to use. You can try different parallel backends without changing your code. You can use it to submit cluster jobs. You’ll have access to great support from the Bioconductor developer team. Those are the big reasons of why I use BiocParallel. But let me go through them a bit more slowly.\nBirthday example I’m going to use as an example the birthday problem where you want to find out empirically the probability that two people share the same birthday in a room.\nbirthday \u0026lt;- function(n) { m \u0026lt;- 10000 x \u0026lt;- numeric(m) for(i in seq_len(m)) { b \u0026lt;- sample(seq_len(365), n, replace = TRUE) x[i] \u0026lt;- ifelse(length(unique(b)) == n, 0, 1) } mean(x) } Naive birthday code Once you have written the code for it, you can then use lapply() or a for loop to calculate the results.\nsystem.time( lapply(seq_len(100), birthday) ) ## user system elapsed ## 25.610 0.442 27.430 Takes around 25 seconds.\nVia doMC If you looked at CRAN Task View: High-Performance and Parallel Computing with R you might have found the doMC (Analytics and Weston, 2015).\nIt allows you to run computations in parallel as shown below.\nlibrary(\u0026#39;doMC\u0026#39;) ## Loading required package: foreach ## Loading required package: iterators ## Loading required package: parallel registerDoMC(2) system.time( x \u0026lt;- foreach(j = seq_len(100)) %dopar% birthday(j) ) ## user system elapsed ## 12.819 0.246 13.309 While it’s a bit faster, the main problem is that you had to change your code in order to be able to use it.\nWith BiocParallel This is how you would run things with BiocParallel.\nlibrary(\u0026#39;BiocParallel\u0026#39;) system.time( y \u0026lt;- bplapply(seq_len(100), birthday) ) ## user system elapsed ## 0.021 0.011 16.095 The only change here is using bplapply() instead of lapply(), so just 2 characters. Well, that and loading the BiocParallel package.\nBiocParallel’s advantages There are many computation backends and one of the strongest features of BiocParallel is that it’s easy to switch between them. For example, my computer can run the following options:\nregistered() ## $MulticoreParam ## class: MulticoreParam ## bpjobname:BPJOB; bpworkers:2; bptasks:0; bptimeout:Inf; bpRNGseed:; bpisup:FALSE ## …","date":1457308800,"expirydate":-62135596800,"kind":"page","lang":"en","lastmod":1741387190,"objectID":"47e980565d1fb4980a766efab61aabd0","permalink":"https://lcolladotor.github.io/2016/03/07/are-you-doing-parallel-computations-in-r-then-use-biocparallel/","publishdate":"2016-03-07T00:00:00Z","relpermalink":"/2016/03/07/are-you-doing-parallel-computations-in-r-then-use-biocparallel/","section":"post","summary":"It’s the morning of the first day of oral conferences at #ENAR2016. I feel like I have a spidey sense since I woke up 3 min after an email from Jeff Leek; just a funny coincidence.","tags":["parallel","Bioconductor"],"title":"Are you doing parallel computations in R? Then use BiocParallel","type":"post"},{"authors":["Leonardo Collado-Torres"],"categories":null,"content":" ","date":1446336000,"expirydate":-62135596800,"kind":"page","lang":"en","lastmod":1621020950,"objectID":"cbadcfa83a86043c79e7a54d52cd4e12","permalink":"https://lcolladotor.github.io/talk/dbfinder2015/","publishdate":"2015-11-01T00:00:00Z","relpermalink":"/talk/dbfinder2015/","section":"talk","summary":"Adapting derfinder to find differentially bound peaks using ChIP-seq data","tags":["dbFinder","Joint Genomics Meeting"],"title":"dbFinder","type":"talk"},{"authors":["Leonardo Collado-Torres"],"categories":null,"content":" ","date":1445472000,"expirydate":-62135596800,"kind":"page","lang":"en","lastmod":1621020950,"objectID":"dcdb26ef27336add05f07ec5296ed43b","permalink":"https://lcolladotor.github.io/talk/gbs2015/","publishdate":"2015-10-22T00:00:00Z","relpermalink":"/talk/gbs2015/","section":"talk","summary":"derfinder overview for the JHU Genomics Symposium 2015","tags":["derfinder"],"title":"Annotation-agnostic differential expression analysis","type":"talk"},{"authors":["Leonardo Collado-Torres"],"categories":null,"content":" ","date":1445291541,"expirydate":-62135596800,"kind":"page","lang":"en","lastmod":1683613619,"objectID":"a4c4008477d8cedfde11289077915602","permalink":"https://lcolladotor.github.io/publication/poster2015/","publishdate":"2015-10-19T16:52:21-05:00","relpermalink":"/publication/poster2015/","section":"publication","summary":"Poster presented at ASHG2015 and IDIES2015","tags":["derfinder","Poster"],"title":"Annotation-agnostic RNA-seq differential expression analysis software","type":"publication"},{"authors":null,"categories":["rstats"],"content":"A couple weeks ago I was given the opportunity to teach a 1 hr 30 min slot of an introduction to R course. In the past, I’ve taught lectures for similar courses, and I ended up asking myself what would be the best short topic to teach and how to teach it.\nBest short topic There are two ways to answer the first question, one boring and one more interesting. The boring answer is that the course instructor selected the topic. The interesting one goes like this. I have taken short R courses before and taught others, and it’s always overwhelming for the students. You get to cover many concepts, get familiarized with R’s syntax, and in the end without lots of practice it’s very challenging to retain much of the information. I think that students love it when they learn how to do something simple that could be the first building block for many of their projects. In parallel, I think that one of the coolest R topics you can learn in an hour is how to create reproducible documents with rmarkdown (Allaire, Cheng, Xie, McPherson, et al., 2015).\nLearning how to use a single function, render() in this case, is as simple as it gets. And using the RStudio Desktop is even simpler. Of course, it can easily get complicated. For example, on a new computer you need to install all the LaTeX dependencies if you want to create PDF files. That task can take some time and maybe scare away some new users. But PDF files are really a plus in this case since you can start creating HTML and Word documents. Other complications arise when a user is interested in more control over formatting the file, but like I said earlier, all you need is a simple building block and rmarkdown is clearly one of them.\nThis is why the final answer to the first question was teaching how to use rmarkdown to create reproducible reports (HTML, Word files) using R.\nHow to teach it Teaching a short topic to a beginner’s audience is no easy feat. In the past I’ve made lectures that have the code for every single step and many links to resources where students can learn some details. That is, I’ve created the lectures in such a way that a student can later use them as reference and follow them without an instructor explaining them.\nThat’s a strategy that I think works on the long run. However, it makes the actual lecture boring and very limited in interactivity. At the JHSPH biostat computing club, other students have chosen to use a lot of images, funny to witty quotes, and asked listeners to voice their opinions. I’ve come to enjoy those presentations and I decided to create my lecture following that trend.\nI started off with a series of questions about reproducible research and asked students to voice their opinions and to define a few key concepts. A couple were aware of the difference between reproducibility and replicability, but most were not. I also questioned them and presented them verbally with some famous cases, so they could realize that it’s a fairly complicated matter. Next I presented some answers and definitions from the Implementing Reproducible Research book.\nSpecifically talking about R, I showed the students several documents I’ve created in the past and asked whether they thought that they could reproduce the results or not. Basically, I wanted to highlight that when using R, you really need the session information if you want to reproduce something. Specially if the analysis involves packages under heavy development.\nAfter having motivating the need for reproducible documents, I briefly showed what rmarkdown is with some images from RStudio shown below.\nThat gave the students a general idea of how these documents look when you are writing them. But the most important part was showing them examples of how the resulting documents look like. That is, I showed them some complicated projects so they could imagine doing one themselves. The examples included some books, but given the audience I think that the one that motivated them most was Alyssa Frazee’s polyester reproducible paper (check the source here). I also showed them some of the cool stuff you can create with HTML documents: basically adding interactive elements.\nFrom there, we left the presentation and I demo’ed how to use RStudio to write rmarkdown documents, the Markdown syntax, where to find help, etc.\nBy this point, I think the lecture was quite complete and the students were motivated. However, from my past experience, I’ve come to realize that students will easily forget a topic if they don’t practice doing it. That is why even before making the lecture I spent quite a bit of time designing two practice labs. Both labs involved creating a rmarkdown document.\nThe first lab included some cool illusion plots which involved a lot of R code. The code wasn’t the point, but simply learning some of the basics such as what is a code chunk, some of Markdown’s syntax, specifying some code chunk options, adding the session information, and using inline R code to show the date when the …","date":1436227200,"expirydate":-62135596800,"kind":"page","lang":"en","lastmod":1741387190,"objectID":"eea70d635dc2e876f4692a19fd67e289","permalink":"https://lcolladotor.github.io/2015/07/07/teaching-a-short-topic-to-beginner-r-users/","publishdate":"2015-07-07T00:00:00Z","relpermalink":"/2015/07/07/teaching-a-short-topic-to-beginner-r-users/","section":"post","summary":"A couple weeks ago I was given the opportunity to teach a 1 hr 30 min slot of an introduction to R course. In the past, I’ve taught lectures for similar courses, and I ended up asking myself what would be the best short topic to teach and how to teach it.","tags":["Teaching"],"title":"Teaching a short topic to beginner R users","type":"post"},{"authors":["Leonardo Collado-Torres"],"categories":null,"content":"","date":1429460121,"expirydate":-62135596800,"kind":"page","lang":"en","lastmod":1621020950,"objectID":"7826b52f70d8cb8a585a053bc146f08b","permalink":"https://lcolladotor.github.io/talk/biocparallel2015/","publishdate":"2015-04-19T16:15:21Z","relpermalink":"/talk/biocparallel2015/","section":"talk","summary":"Introducing BiocParallel and knitrBootstrap to the JHU Biostat Computing Club","tags":["Computing Club"],"title":"Easy parallel computing with BiocParallel and HTML reports with knitrBootstrap","type":"talk"},{"authors":["Leonardo Collado-Torres"],"categories":null,"content":" Dissecting human brain development at high resolution using RNA-seq from lcolladotor ","date":1426464000,"expirydate":-62135596800,"kind":"page","lang":"en","lastmod":1621020950,"objectID":"886d2fd6961bbfec1562795f8c13288e","permalink":"https://lcolladotor.github.io/talk/enar2015/","publishdate":"2015-03-16T00:00:00Z","relpermalink":"/talk/enar2015/","section":"talk","summary":"derfinder overview for ENAR2015","tags":["derfinder"],"title":"Dissecting human brain development at high resolution using RNA-seq","type":"talk"},{"authors":["Leonardo Collado-Torres"],"categories":null,"content":" ","date":1424340000,"expirydate":-62135596800,"kind":"page","lang":"en","lastmod":1621020950,"objectID":"68b3cd95fd88d2c24ddbcd7c3dba9db4","permalink":"https://lcolladotor.github.io/talk/mapping2015/","publishdate":"2015-02-19T10:00:00Z","relpermalink":"/talk/mapping2015/","section":"talk","summary":"Exploring how simulated RNA reads affects mapping for the JHU Joint Genomic Meeting","tags":["polyester","Joint Genomics Meeting"],"title":"Does mapping simulated RNA-seq reads provide information?","type":"talk"},{"authors":null,"categories":["Ideas"],"content":"My advisor recently asked me to fill a career planning document (he’ll blog about it at some point) that has lots of questions and is being very useful. Trying to fill answer all these questions has gotten me thinking about other important things for the future. Two of them being reasonable expectations for work hours and salary in a biostats/genomics academic career.\nI find these questions hard to answer and even hard to talk about, and if you know me, I’m a person that asks lots of questions. I have also been advised against talking about these subjects during a first interview because it’s important to focus on the research environment. I agree that you should find a place to work that you like with problems that will keep you motivated, and with colleagues that make your daily life enjoyable (Hall, 2015).\nHowever, I still want to have a reasonable idea about what to expect. Given that it’s hard to ask these questions, it’s also hard to blog about it. These questions are not really what others encourage you to talk about (Gould, 2015; Gould, 2014) but I think that I’m not the only one with these questions in mind and that others might benefit from this post. Well, I hope they will.\nI didn’t ask myself these questions before doing a PhD. It felt natural that doing a PhD would open the door for more opportunities in academia than going to work after undergrad or a masters. Even for a career outside science which a bit more than half (53%) of UK science PhD students choose to follow (Gould, 2014), getting a PhD likely gives a strong boost to your career options. But when you start considering a postdoc, there is an opportunity cost (, 2015) associated to it because you could be earning more at a non-academic job. But how much are we talking about?\nPicture from “The postdoc decision” (Gould, 2014).\nRegardless of the opportunity cost of doing a postdoc, for a career in academia you will likely want to do a postdoc to get a chance at a tenure-track job, specially in fields like biology. For a career outside academia but still research related, I think that doing a postdoc could increase your chances at getting a better job. In any case, you have to consider all career options when doing a postdoc (, 2014).\nSalary: what to expect For a postdoc, the NIH sets training stipends which sets a baseline (, 2015). For example, 42k per year in 2014.\nFor later, ASA: Career Resources for Statisticians has information for biostatistics departments. For example, the median year 0 assistant professor in a biostatistics department made 102k (megan, 2014). From this survey data you can get an idea of the salary progression through your academic career.\nSimilarly, I find the Life Sciences Salary Survey (2013, 2014) informative. In the 2014 detailed pdf you can see that a male postdoc average pay was $46,372, $79,616 for an assistant professor, $107,868 for associate professors, and $158,059 for professors. That last figure is smaller than $169,900 which is the median salary for year 0 professors in biostatistics (megan, 2014). The 2014 Life Sciences survey also has average salaries by age. So you can make three different progressions of your career salary.\nWhy should you care? There are probably many reasons why you should care about your salary given two or more equally good work opportunities. In my case, I wanted to get a rough idea if an academic career would be able to pay for my desired lifestyle and life goals. Let me explain this in more detail.\nFrom looking at the retirement for doctoral scientists report (Foundation, 2015) retiring between 66 and 70 years old seems like a common scenario. Then from the life expectancy calculator (OACT, 2015), it seems that for someone like me the average life expectancy is 87 years and retiring from work at 67 years. That is, about 37 years of work and 20 years of retirement. Then, the average cost of a house is about 320k (McBride, 2014). If you get a house loan for 270k at 4% interest rate for 30 years and 1.25% property tax you would pay 190k in interest and 120k in tax (Unknown, 2015). Federal income tax is about 28% (, 2015) (I know it’s more complicated) with about 5% for state tax (, 2015). So about 33% of your income goes to paying taxes. The cost for having a car is about 10k a year (Larry Copeland, 2013) although you could probably save some money by getting a smaller car.\nI think that I want to have children in the future, and if I do, I would like to afford their education. It seems that the cost of raising a child to age 18 is about 575k if you spend about 120k in private college (, 2015). Those numbers include the cost of adapting your house (but not interests in mortgage).\nI also want to be able to travel quite a bit, and given that these are all US numbers, I would also like to go to Mexico frequently. Anyhow, setting about 5k a year for traveling is an ambitious goal. Alternatively, the 5k could help mitigate any unforeseen emergency, like a surgery.\nI can use the …","date":1423699200,"expirydate":-62135596800,"kind":"page","lang":"en","lastmod":1741387190,"objectID":"92834a585e694d962024efa85938651b","permalink":"https://lcolladotor.github.io/2015/02/12/what-are-reasonable-work-hours-and-salary-expectations-for-biostats/genomics-careers/","publishdate":"2015-02-12T00:00:00Z","relpermalink":"/2015/02/12/what-are-reasonable-work-hours-and-salary-expectations-for-biostats/genomics-careers/","section":"post","summary":"My advisor recently asked me to fill a career planning document (he’ll blog about it at some point) that has lots of questions and is being very useful. Trying to fill answer all these questions has gotten me thinking about other important things for the future.","tags":["work-life"],"title":"What are reasonable work hours and salary expectations for biostats/genomics careers?","type":"post"},{"authors":["Jaffe AE","Shin J","Leonardo Collado-Torres","Leek JT","Tao R","Li C","Gao Y","Jia Y","Maher BJ","Hyde TM","Kleinman JE","Weinberger DR"],"categories":null,"content":" Developmental regulation of human cortex transcription and its clinical relevance at single base resolution http://t.co/0R5n6JV9Bk\n— Andrew Jaffe (@andrewejaffe) December 15, 2014 ","date":1419027468,"expirydate":-62135596800,"kind":"page","lang":"en","lastmod":1651425968,"objectID":"958d4406d228fd52b61a46337066e2ce","permalink":"https://lcolladotor.github.io/publication/2014-12_brainders/","publishdate":"2014-12-19T17:17:48-05:00","relpermalink":"/publication/2014-12_brainders/","section":"publication","summary":"Transcriptome analysis of human brain provides fundamental insight into development and disease, but it largely relies on existing annotation. We sequenced transcriptomes of 72 prefrontal cortex samples across six life stages and identified 50,650 differentially expression regions (DERs) associated with developmental and aging, agnostic of annotation. While many DERs annotated to non-exonic sequence (41.1%), most were similarly regulated in cytosolic mRNA extracted from independent samples. The DERs were developmentally conserved across 16 brain regions and in the developing mouse cortex, and were expressed in diverse cell and tissue types. The DERs were further enriched for active chromatin marks and clinical risk for neurodevelopmental disorders such as schizophrenia. Lastly, we demonstrate quantitatively that these DERs associate with a changing neuronal phenotype related to differentiation and maturation. These data show conserved molecular signatures of transcriptional dynamics across brain development, have potential clinical relevance and highlight the incomplete annotation of the human brain transcriptome.","tags":["derfinder"],"title":"Developmental regulation of human cortex transcription and its clinical relevance at single base resolution","type":"publication"},{"authors":["Leonardo Collado-Torres"],"categories":null,"content":"","date":1419005961,"expirydate":-62135596800,"kind":"page","lang":"en","lastmod":1621020950,"objectID":"2df639b38246860009a8dd35d9b9aec2","permalink":"https://lcolladotor.github.io/talk/dertutor2014/","publishdate":"2014-12-19T16:19:21Z","relpermalink":"/talk/dertutor2014/","section":"talk","summary":"derfinder tutorial for Leek's group lab meeting","tags":["derfinder"],"title":"derfinder tutorial","type":"talk"},{"authors":null,"categories":["rstats"],"content":"As a user Imagine that you are starting to learn how to use a specific R package, lets call it foo. You will look at the vignette (if there is one), use help(package = foo), or look at the reference manual (for example, devtools’ ref man). Eventually, you will open the help page for the function(s) you are interested in using.\n?function_I_want_to_use In many packages, there is a main use case that is addressed by the package. A common strategy is to export a main function. That function will likely have a long list of arguments. So as a new user, you are suddenly exposed to a complicated help page and you will want to figure out which arguments you need to use.\nAs a developer From the developer’s side, you want to give users control over several details. Each detail you want the user to control involves one more argument in your function. Sooner rather than later, you will have a long list of arguments. This increases the learning curve for new users of your package, and can potentially scare them away. That is contradictory of another goal you have as a developer: you want to get people to use your package.\nLets say that you are developing the function use_me(). If the details you want the users to control are actually arguments of other functions used inside use_me(), then you can simplify your function by using the ... argument. This argument is very well explained at The three-dots construct in R (Burns, 2013). It is very useful and can greatly simplify your life as a developer. Plus, it reduces the length of your help pages, thus making your package more user friendly.\nHowever, if some of the details in use_me() are not arguments to other functions, then the common strategy is to write two functions. One is a low level function with arguments for all the details which might or might not export. Then, you write a second function that is a wrapper for the low level function and pre-specifies values for all the details. See the next minimal example:\n# Don\u0026#39;t export this function .use_me \u0026lt;- function(arg1, arg2, verbose = TRUE) { if(verbose) message(paste(Sys.time(), \u0026#39;working\u0026#39;)) pmax(arg1, arg2) } #\u0026#39; @export use_me \u0026lt;- function(arg1, ...) { .use_me(arg1, 0, ...) } ## Lets see it in action use_me(1:3) ## 2014-12-11 17:03:32 working ## [1] 1 2 3 use_me(-1:1, verbose = FALSE) ## [1] 0 0 1 In this example, the help page for use_me() is fairly short and friendly. You don’t expect users to be interested in changing arg2 much. Surely you could make it so the non-exported function .use_me() sets a default value for arg2.\nAnother strategy is to specify inside use_me() the default values for all the arguments you want to use while keeping the list of visible arguments short. That is, maintain the user friendliness of your functions while also giving them control over all the details. That is what you can do using dots() from dots (Collado-Torres, 2014). dots() is a very simple function that checks if ... has a specific argument, and if absent, it returns a default value. It can be seen in action below:\nlibrary(\u0026#39;dots\u0026#39;) use_me_dots \u0026lt;- function(arg1, ...) { ## Default hidden arguments arg2 \u0026lt;- dots(name = \u0026#39;arg2\u0026#39;, value = 0, ...) verbose \u0026lt;- dots(\u0026#39;verbose\u0026#39;, TRUE, ...) ## Regular code if(verbose) message(paste(Sys.time(), \u0026#39;working\u0026#39;)) pmax(arg1, arg2) } use_me_dots(1:3) ## 2014-12-11 17:03:32 working ## [1] 1 2 3 use_me_dots(-1:1, verbose = FALSE) ## [1] 0 0 1 use_me_dots(-1:1, verbose = FALSE, arg2 = 5) ## [1] 5 5 5 dots is my solution to the problem of keeping functions user friendly while giving them control over all the details. The idea is that experienced users will be able to find what the advanced arguments are. While they could find them from the code itself, I do recommend describing the advanced arguments in a vignette targeted for these users.\nComplications Now, while ... is great, you might run into problems when use_me() calls two functions that have different arguments and that don’t have the ... argument. Such a scenario is illustrated below.\nstatus \u0026lt;- function(arg3, status = TRUE) { if(status) print(arg3) return(invisible(NULL)) } use_me_again \u0026lt;- function(arg1, ...) { res \u0026lt;- .use_me(arg1, 0, ...) status(res, ...) return(res) } ## Seems to work x \u0026lt;- use_me_again(1) ## 2014-12-11 17:03:32 working ## [1] 1 ## But nope, it doesn\u0026#39;t use_me_again(1, verbose = FALSE, status = FALSE) ## Error in .use_me(arg1, 0, ...): unused argument (status = FALSE) This scenario can happen when you are using functions from other packages. It’s happened to me in cases where the main function does have a ... argument but uses several internal functions that don’t use it.\nIn such situations, you might want to use formal_call() from dots. It figures out which are the arguments formally used by the function of interest and drops out un-used arguments from ..., thus avoiding this type of problem.\nuse_me_fixed \u0026lt;- function(arg1, ...) { res \u0026lt;- formalCall(.use_me, arg1 = arg1, arg2 = 0, ...) formal_call(status, arg3 = res, ...) return(res) } …","date":1418256000,"expirydate":-62135596800,"kind":"page","lang":"en","lastmod":1741387190,"objectID":"8f30f4b0d01ba56ccf68f00c089251b4","permalink":"https://lcolladotor.github.io/2014/12/11/use-hidden-advanced-arguments-for-user-friendly-functions/","publishdate":"2014-12-11T00:00:00Z","relpermalink":"/2014/12/11/use-hidden-advanced-arguments-for-user-friendly-functions/","section":"post","summary":"As a user Imagine that you are starting to learn how to use a specific R package, lets call it foo. You will look at the vignette (if there is one), use help(package = foo), or look at the reference manual (for example, devtools’ ref man).","tags":["Help"],"title":"Use hidden advanced arguments for user-friendly functions","type":"post"},{"authors":null,"categories":["rstats"],"content":"This is a guest post by Prasad Patil that answers the question: how to put a shape in the margin of an R plot?\nThe help page for R’s par() function is a somewhat impenetrable list of abbreviations that allow you to manipulate anything and everything in the plotting device. You may have used this function in the past to create an array of plots (using mfrow or mfcol) or to set margins (mar or mai).\nWay down toward the end of the list is the often-overlooked xpd parameter. This value specifies where in the plotting device an object can actually be plotted. The default is xpd = FALSE, which means that plotting is clipped, or restricted, to the plotting region. In other words, if your plot has xlim = c(0, 10) and ylim = c(0, 10) and you try to plot the point (-1, -1), it will not appear anywhere in the device.\nxpd takes two other values, TRUE and NA, which limit plotting to the figure and device region, respectively. If you’re fuzzy on plotting terms, this tutorial presents those topics well.\nPlotting outside the plot If you want to plot outside of the plotting region, I find that setting xpd = NA easiest since it opens up all external space. We also need to make sure that we keep space outside of the plot so that we have room to place our objects. Let’s say we want to put an ugly border above and below our plot:\n# Set xpd=NA and expand the top and bottom margins par(xpd = NA, mar = par()$mar + c(2.5, 0, 1, 0)) plot(1:10) # Note that the rectangle we make here has corner coordinates outside of # our plotting device rect(-5, 11, 12, 14, col=\u0026#34;red\u0026#34;) # Random dots in our rectangluar region points(runif(100, -4.2, 12.8), runif(100, 11.2, 13.6), col = \u0026#34;green\u0026#34;, pch = 19, cex = 1.2) # And another rectangle for below rect(-5, -1.7, 12, -3.5, col=\u0026#34;red\u0026#34;) points(runif(100, -4.2, 12.8), runif(100, -3.3, -1.8), col = \u0026#34;green\u0026#34;, pch = 19, cex = 1.2) Here we mentally extend the axes of our plot to determine where to put our margin elements. One can imagine a diagonal for the top rectangle running from (-5,11) to (12,14). Neither of these points appear in the plot itself, but we used the established axes to estimate them and plot outside the plotting region.\nImages outside the plot Now let’s say we want to add a logo or other external image in the margin of our plot. We will use R’s png library to load a PNG image and rasterImage() to plot it:\n## If needed: install.packages(\u0026#34;png\u0026#34;) library(png) img \u0026lt;- readPNG(\u0026#34;logo.png\u0026#34;) par(xpd = NA, mar=par()$mar + c(3, 0, 0, 0)) plot(1:10) rasterImage(img, 0.5, -2.5, 10.5, -1) Here we used the png library and the r asterImage() command to read in and plot the “logo.png” file. Based on the previously-known dimensions of the logo, we can choose which points to use as endpoints for the image. Note that this image may appear stretched or contorted depending on the size of your R plot device, and it will not stay consistent if you resize.\n","date":1416528000,"expirydate":-62135596800,"kind":"page","lang":"en","lastmod":1741387190,"objectID":"900007201e0d5a3332ce9e39a8578e33","permalink":"https://lcolladotor.github.io/2014/11/21/an-xpd-tion-into-r-plot-margins/","publishdate":"2014-11-21T00:00:00Z","relpermalink":"/2014/11/21/an-xpd-tion-into-r-plot-margins/","section":"post","summary":"This is a guest post by Prasad Patil that answers the question: how to put a shape in the margin of an R plot?\nThe help page for R’s par() function is a somewhat impenetrable list of abbreviations that allow you to manipulate anything and everything in the plotting device.","tags":["Graphics"],"title":"An xpd-tion into R plot margins","type":"post"},{"authors":null,"categories":["rstats"],"content":"I was recently asked where do I get started with Bioconductor? and thought this would be a good short post.\nWhat is BioC? Briefly, Bioconductor (Gentleman, Carey, Bates, and others, 2004) is an open source project that hosts a wide range of tools for analyzing biological data with R (R Core Team, 2014). These analysis tools are bundled into packages which are designed to answer specific questions or to provide key infrastructure. If this sounds like something you are interested in, visit bioconductor.org.\nObviously, you need to know the basics about R in order to use Bioconductor.\nGetting started bioconductor.org has a section in it’s front page titled get started with Bioconductor. There you will find links that explain how to install it or to explore the available packages.\nYou have a use case If you have a particular use case in mind, I recommend browsing the software packages and searching for some key words. For example, you might be interested in high throughput sequencing of RNAs and if you search RNAseq or RNA-seq you can find a good set of packages to start. Alternatively, use the biocViews tree menu to explore specific categories of packages.\nOnce you find a set of packages that have descriptions that appeal to you, explore their vignettes. These are either PDF or HTML documents that explain what the package does to new users. They also exemplify how to tie together the different functions in the package, which is a key piece of information. For example, in the RNA-seq example you will find the DEXSeq package. DEXseq (Anders, Reyes, and Huber, 2012) has a vignette called Analyzing RNA-seq data for differential exon usage with the “DEXSeq” package and from the page of the package you can access the PDF vignette.\nThen it’s just a matter of exploring other packages, checking the vignettes and learning as you go.\nYou don’t have a use case If you don’t have a specific use case in mind, it might pay off to start by exploring the Bioconductor workflows. These documents explain how to use different packages to accomplish specific type of analyses. They are great to learn what you can do with Bioconductor!\nAnother option is to look at the previous courses. For example, under the 2008 courses you’ll find to the course R/Bioconductor Curso Intensivo (Spanish) which I taught back in the day. As much as I would like to self promote myself, the best starting point is the most recent BioC20XX course: BioC2014. It has slides showcasing some of the newest packages and tutorials on how to use them.\nAn alternative is to look at some of the Bioconductor publications which includes books about Bioconductor and research papers describing some of the packages.\nOnce you find a set of packages that catch your eye, go look at their vignettes just like I explained in the you have a use case scenario.\nHelp tips It’s not a matter of whether you will need help learning how to use Bioconductor. It’s just a matter of when. So don’t feel bad about having to ask for help!!\nThe very first place to start is to look at bioconductor.org at the Help section in the bottom. For example, you can find youtube videos contributed under the community section. There you can also find links to other blog posts explaining how to use Bioconductor. Take a peak at the other sections under Help before using the Bioconductor support site: it’s where you can ask very specific questions and interact with the maintainers of the packages you are using.\nFinally, if you are interested in new developments, then check the latest newsletter, for example the October 2014 one.\nGood luck using Bioconductor!\nReferences Citations made with knitcitations (Boettiger, 2014).\n[1] S. Anders, A. Reyes and W. Huber. “Detecting differential usage of exons from RNA-seq data.” In: Genome Research 22 (2012), p. 4025. DOI: 10.1101/gr.133744.111.\n[2] C. Boettiger. knitcitations: Citations for knitr markdown files. R package version 1.0.2. 2014. URL: https://github.com/cboettig/knitcitations.\n[3] R. C. Gentleman, V. J. Carey, D. M. Bates and others. “Bioconductor: Open software development for computational biology and bioinformatics”. In: Genome Biology 5 (2004), p. R80. URL: http://genomebiology.com/2004/5/10/R80.\n[4] R Core Team. R: A Language and Environment for Statistical Computing. R Foundation for Statistical Computing. Vienna, Austria, 2014. URL: http://www.R-project.org/.\nWant more? Check other @jhubiostat student blogs at Bmore Biostats as well as topics on #rstats.\n","date":1413417600,"expirydate":-62135596800,"kind":"page","lang":"en","lastmod":1741387190,"objectID":"1a675378289e4e2f06e25c3fcadf1932","permalink":"https://lcolladotor.github.io/2014/10/16/where-do-i-start-using-bioconductor/","publishdate":"2014-10-16T00:00:00Z","relpermalink":"/2014/10/16/where-do-i-start-using-bioconductor/","section":"post","summary":"I was recently asked where do I get started with Bioconductor? and thought this would be a good short post.\nWhat is BioC? Briefly, Bioconductor (Gentleman, Carey, Bates, and others, 2004) is an open source project that hosts a wide range of tools for analyzing biological data with R (R Core Team, 2014).","tags":["Bioconductor"],"title":"Where do I start using Bioconductor?","type":"post"},{"authors":null,"categories":["Misc"],"content":"This summer a few of us at Bmore Biostats agreed to a summer iron blogger challenge. We either had to blog every week or every two weeks. The penalty of not publishing a post in our chosen timeframe was to donate 5 or 10 USD (respectively) to our charity of choice.\nI liked the idea of the blogging challenge and thought it would help me keep motivated to keep my blog active during the summer. However, I totally failed and only posted twice during the 16 week summer. That is, I have to donate 14 * 5 = 70 USD. I think that most of us blogged a lot less than what we were hoping to and potentially owe a charity some money. But well, there is no real obligation to donate and I don’t expect others to do so. However, I want to do it. Doing so will help me take a iron blogger challenge more seriously next time.\nKiva As a charity of my choice, I ended up choosing Kiva. Through them you can loan 25 USD to an individual or group that needs the money to improve their business, home, etc. And in general, you get your money back. Alternatively, you can donate your money from the get go or keep re-loaning it instead of withdrawing it back to your bank.\nIt is my first time doing something like this, so I am going to ask for the money back and then re-loan it as I see fit. So, because strictly speaking I am not donating it, I decided to increase my entry to 100 USD. That is, 4 Kiva loans.\nKiva recommends lending to different individuals, Kiva partners, and countries to diversify your risk. Being born in Mexico, I wanted to specifically help people from there. If you restrict the search to Mexico, currently there are 13 open loans. From them, I chose:\nAurea administered by Eblock International. She wants to install a floor in her room. It seems like she has used other Kiva loans to slowly build her house. Sonia administered by Kubo Financiero. She wants to buy recycling materials for her business. Mujeres Mazahuas Group who are re-stocking their grocery business. The loan is administered by VisionFund Mexico who have gotten loans for over 6 million since 2009. That’s a large chunk of the 16 million that Kiva has sent to Mexico. Gabino administered by Sistema Biobolsa. He wants a biodigester which will help him in his agriculture business. Hopefully the loans will be used properly! But like my friend who has experience in micro-banks in Mexico tells me, it is very hard to know that. We’ll see what happens.\nFor the meantime, here is my receipt.\nJoin Kiva For whatever’s worth, here is my Kiva invitation link: kiva.org/invitedby/fellgernon.\nWant more? Check other @jhubiostat student blogs at Bmore Biostats as well as topics on #rstats.\n","date":1412294400,"expirydate":-62135596800,"kind":"page","lang":"en","lastmod":1741387190,"objectID":"5032a26e2788ed0160df269a3770abfe","permalink":"https://lcolladotor.github.io/2014/10/03/end-of-the-summer-blogger-challenge/","publishdate":"2014-10-03T00:00:00Z","relpermalink":"/2014/10/03/end-of-the-summer-blogger-challenge/","section":"post","summary":"This summer a few of us at Bmore Biostats agreed to a summer iron blogger challenge. We either had to blog every week or every two weeks. The penalty of not publishing a post in our chosen timeframe was to donate 5 or 10 USD (respectively) to our charity of choice.","tags":["kiva"],"title":"End of the summer blogger challenge","type":"post"},{"authors":["Leonardo Collado-Torres"],"categories":null,"content":" ","date":1407110400,"expirydate":-62135596800,"kind":"page","lang":"en","lastmod":1621020950,"objectID":"742d9566042d875006efaf2b84cca0a1","permalink":"https://lcolladotor.github.io/talk/is3b2014/","publishdate":"2014-08-04T00:00:00Z","relpermalink":"/talk/is3b2014/","section":"talk","summary":"In depth overview of derfinder and it's applications to the human brain for the IS3B-INMEGEN conference","tags":["derfinder"],"title":"Developmental regulation of human cortex transcription at base-pair resolution","type":"talk"},{"authors":["AC Frazee","L Collado-Torres","AE Jaffe","B Langmead","JT Leek"],"categories":null,"content":" ","date":1403041344,"expirydate":-62135596800,"kind":"page","lang":"en","lastmod":1597191431,"objectID":"3a35c57ba978f0ed36e56c72982d26ae","permalink":"https://lcolladotor.github.io/publication/2014-06_rnaseqbook/","publishdate":"2014-06-17T16:42:24-05:00","relpermalink":"/publication/2014-06_rnaseqbook/","section":"publication","summary":"There has been a major shift from microarrays to RNA-sequencing (RNA-seq) for measuring gene expression as the price per measurement between these technologies has become comparable. The advantages of RNA-seq are increased measurement flexibility to detect alternative transcription, allele specific transcription, or transcription outside of known coding regions. The price of this increased flexibility is: (a) an increase in raw data size and (b) more decisions that must be made by the data analyst. Here we provide a selective review and extension of our previous work in attempting to measure variability in results due to different choices about how to summarize and analyze RNA-sequencing data. We discuss a standard model for gene expression measurements that breaks variability down into variation due to technology, biology, and measurement error. Finally, wee show the importance of gene model selection, normalization, and choice for statistical model on the ultimate results of an RNA-sequencing experiment.","tags":["derfinder"],"title":"Measurement, Summary, and Methodological Variation in RNA-sequencing in Statistical Analysis of Next Generation Sequencing Data","type":"publication"},{"authors":null,"categories":["rstats"],"content":"A few weeks ago I was invited to a meeting where a group was interested in exploring options for replacing their contract with a propriety software. They invited me because they saw some resemblances between a Shiny application I made and the features they need. It is a relatively small project and it seemed feasible to implement, but well, some details could have been tricky to code. During the meeting I explained what Shiny is, showcased some of the Shiny apps I’ve made, and proposed some options including a simple site password.\nA few days after the meeting, they raised three concerns.\nPrivacy and security of their data. Specially with distribution of the site password. Technical support. They wanted something more than community support. Continuity of the project. Specially since their team might lack the technical expertise to support and modify the Shiny app after it is built. These are all valid concerns and they are not something I have dealt with or been concerned with other Shiny apps I have deployed. Thus, I ended up finding more information and writing up a long reply which I am modifying into a post format here. If you identify other ways to approach these concerns that I missed, share the knowledge please!\nShiny overview Shiny is an R package that allows creating web applications with R. A user opens the app on their browser, specifies a given set of inputs, these are transmitted to an R session, some code is evaluated with the input options, output is produced and transmitted back to the browser. Because it is so easy to use and useful, it has been very popular. That is the gist of it!\nDeploying a Shiny app Once you develop a Shiny app, you have to deploy it on a server so users can access it through their browsers. Here I describe several options to do so.\nThe application itself needs “Shiny Server” to run. An implementation of Shiny Server is free via ShinyApps (option 1) or if you have your own server you can install the open source version of Shiny Server (option 2). Alternatively, you can pay for Shiny Server Pro and also install it in your own server (option 3). Note that glimmer.rstudio.com is previous version of ShinyApps and you can no longer get accounts on this server.\nOption 1 has the advantage of being completely free and that there is no need to pay for your own server. It does rely on ShinyApps being online, which should not be a main problem since it is hosted on the cloud. Meaning that it is supposed to be robust.\nOption 2 has the advantage of having technical support for the server (not the app) from whoever is providing the server (could be a company or the school). However, you need to have someone capable of installing Shiny Server and updating it whenever it’s necessary to do so.\nOption 3 allows you to have high level password security (via SSL) to any Shiny app you host. Plus RStudio provides technical support for Shiny. The server technical support would still have to come from whoever is providing the server. The main disadvantage is that this option is very expensive (even with the academic pricing discount).\nHere is some information you might be interested on checking about Shiny:\nMain site for Shiny Description for Shiny Server and Shiny Server Pro Academic pricing for Shiny Server Pro Description of ShinyApps Site for learning how to code a web app using Shiny Examples of Shiny apps Concerns Privacy Privacy issues in terms of password sharing can be limited by changing the password frequently. Privacy in terms of protection versus hacking is a different subject and I could implement something like this demo (username: withr, password: 12345678) as described in this blog post. However, if you want further protection vs hacking, you would need Shiny Server Pro. Here is a demo of the security provided by Shiny Server Pro (with multiple users too). I understand that hacking was not the main concern you had, but well, as I said password-sharing can be mitigated by frequent changes to the app site.\nTechnical support I mostly answered the different options regarding technical support when I described the three options for deploying a Shiny app. As for getting support from IT, they would need to learn how to use Shiny.\nContinuity Shiny is one of the most important projects for RStudio so they invest a lot in it, the community provides great answers very quickly, and a lot of people are learning how to use it. If you need an R programmer later on instead of a student, you could describe the job at R Users and employ someone that way. As far as the Biostats department is concerned, I know that several students are using Shiny and some have even published Shiny Apps in the academic literature. Here are some examples:\ninterAdapt is a Shiny app written by Aaron Fisher (Biostats student) and published here. shinymethyl, a shiny application developed by Jean-Philippe Fortin described here with a demo here. committees is a Shiny app made by Alyssa Frazee for verifying your school …","date":1402358400,"expirydate":-62135596800,"kind":"page","lang":"en","lastmod":1741387190,"objectID":"228ba15015df5d740627a91467be752f","permalink":"https://lcolladotor.github.io/2014/06/10/concerns-that-can-deter-potential-orders-for-developing-shiny-apps/","publishdate":"2014-06-10T00:00:00Z","relpermalink":"/2014/06/10/concerns-that-can-deter-potential-orders-for-developing-shiny-apps/","section":"post","summary":"A few weeks ago I was invited to a meeting where a group was interested in exploring options for replacing their contract with a propriety software. They invited me because they saw some resemblances between a Shiny application I made and the features they need.","tags":["shiny"],"title":"Concerns that can deter potential orders for developing Shiny apps","type":"post"},{"authors":null,"categories":["rstats"],"content":"Have you ever thought of borrowing some money? A common case is when you have to borrow money for buying a house, which is called a mortgage. Wikipedia (‘Mortgage loan’ entry) goes into much more detail about the definition than what I’ll cover.\nOne of the aspects you have to evaluate when considering a loan such as a mortgage is how much interest you will be charged and how long the loan will be. Those two determine your monthly payment.\nComparing loans That is, given the loan amount, you can compare different loans that offer different rates and/or loan lengths. There are many tools out there that allow you to do so and are generally called mortgage calculators. Although the more detailed term is amortization calculator. From wikipedia(‘Amortization calculator’ entry) we find the so called annuity formula which helps you calculate your monthly payment.\nSeveral such mortgage calculators have been features in R Bloggers before such as (C, 2010) and (BioStatMatt). Plus there are many other alternatives on the web.\nMy use case However, a month or so ago I got curious about comparing some loans which had a different twist than normal. Given some circumstances, I wanted to compare some loans where the loaner is willing to receive payments every few months yet with interests being compounded (that is, calculated) on a different time frame. Obviously, the easiest would be to compound interest at the same frequency as payments are made. Plus, probably most banks would not offer such flexible loans.\nDigging around, I did find modifications to the annuity formula that allow non-monthly payments (Compound Interest Formula) and (What is compound interest?).\nshiny app Being interested in R code, shiny (RStudio Inc.) apps and trying out integrating rCharts (Vaidyanathan, 2013) with shiny, I ended up coding my own mortgage calculator which you can find here (Simple Mortage Calculator). The code is publicly available at GitHub.\nIt has a couple of simple inputs:\nAmount to borrow Interest rate Loan duration Payment frequency How frequently interests are compounded Month of the first payment The option to begin the loan now but accept the first payment much later is there also because of the complicated use case I had in mind. Again, that is a feature a bank will most likely not offer. But it’s something I needed to take into consideration.\nGoing back to the app, I tried explaining all the inputs as much as possible. The output is relatively straight forward.\nFirst, there is a line with focus D3 interactive plot (Line Chart with View Finder) which shows the principal (the amount you owe) over months as well as how much you’ve paid already. The bottom panel allows you to zoom into a specific time range as shown below.\nNext, the information is shown in more detail as an interactive data table (DataTables) 12 months at a time. The interactive part makes it very easy to search for a specific month and look at the state of the loan.\nFinally, you can download the amortization table in CSV format for your records.\nPS You can also access the app via shinyapps at this url. It is the first time I’ve deployed an app there as I wanted to test shinyapps out.\nConclusions The experience of coding the shiny app (Simple Mortage Calculator) was interesting as I did learn a couple of new things. The same was true for figuring out the calculations for the more flexible options.\nFinally, but not least, the shiny app was useful for my use case and was informative for comparing different loan options. Hopefully it will be useful for other users!\nReferences Citations made with knitcitations (Boettiger, 2014).\nMortgage loan - Wikipedia, the free encyclopedia. Wikipedia http://en.wikipedia.org/wiki/Mortgage_loan Amortization calculator - Wikipedia, the free encyclopedia. Wikipedia http://en.wikipedia.org/wiki/Amortization_calculator C, (2010) Mortgage Calculator (and Amortization Charts) with R. R-Chart http://www.r-chart.com/2010/11/mortgage-calculator-and-amortization.html BioStatMatt, Mortgage Refinance Calculator | BioStatMatt. BioStatMatt http://biostatmatt.com/archives/1908 Compound Interest Calculator. http://www.calculator.net/compound-interest-calculator.html Compound Interest. http://math.about.com/library/weekly/aa042002a.htm Simple Mortgage Calculator. http://glimmer.rstudio.com/lcolladotor/mortgage/ Novus Partners, Line Chart With View Finder - NVD3. http://nvd3.org//examples/lineWithFocus.html DataTables (table plug-in for jQuery). DataTables (jQuery plug-in) https://datatables.net/ Carl Boettiger, (2014) knitcitations: Citations for knitr markdown files. http://CRAN.R-project.org/package=knitcitations Ramnath Vaidyanathan, (2013) rCharts: Interactive Charts using Polycharts.js. RStudio , Inc. , (2014) shiny: Web Application Framework for R. http://CRAN.R-project.org/package=shiny Reproducibility sessionInfo() ## R version 3.1.0 (2014-04-10) ## Platform: x86_64-apple-darwin10.8.0 (64-bit) ## ## locale: ## [1] …","date":1398124800,"expirydate":-62135596800,"kind":"page","lang":"en","lastmod":1741387190,"objectID":"fe640865fc1b313c92ea1ce74f2245b7","permalink":"https://lcolladotor.github.io/2014/04/22/simple-mortgage-calculator/","publishdate":"2014-04-22T00:00:00Z","relpermalink":"/2014/04/22/simple-mortgage-calculator/","section":"post","summary":"Have you ever thought of borrowing some money? A common case is when you have to borrow money for buying a house, which is called a mortgage. Wikipedia (‘Mortgage loan’ entry) goes into much more detail about the definition than what I’ll cover.","tags":["shiny"],"title":"Simple mortgage calculator","type":"post"},{"authors":["Leonardo Collado-Torres"],"categories":null,"content":"","date":1396542026,"expirydate":-62135596800,"kind":"page","lang":"en","lastmod":1621020950,"objectID":"9a0cf18daacff4fe9c0b59016b18af33","permalink":"https://lcolladotor.github.io/talk/git2014/","publishdate":"2014-04-03T16:20:26Z","relpermalink":"/talk/git2014/","section":"talk","summary":"Introducing git for use in research at the JHU Biostat Computing Club","tags":["Computing Club"],"title":"Git for research","type":"talk"},{"authors":["Leonardo Collado-Torres"],"categories":null,"content":" ","date":1395265941,"expirydate":-62135596800,"kind":"page","lang":"en","lastmod":1683613619,"objectID":"cda4f4f2f0736e75db778aece8d4d91f","permalink":"https://lcolladotor.github.io/publication/poster2014enar/","publishdate":"2014-03-19T16:52:21-05:00","relpermalink":"/publication/poster2014enar/","section":"publication","summary":"Poster presented at ENAR2014","tags":["derfinder","Poster"],"title":"Fast Annotation-Agnostic Differential Expression Analysis","type":"publication"},{"authors":null,"categories":["rstats"],"content":"It’s exciting when great people help each other get things done This is a simple networking story, which might not be surprising to some but I was happily surprised by it. This is how the story goes:\nTwo weeks ago rMaps (Vaidyanathan, 2014) was released. After making a blog post about it I thought about using it to make a map of the homicide rate in Mexico over the recent years. First, I had the question of how to make custom maps with rMaps. @tyokota had the same question and started asking Ramnath about it in rMaps issue 6. Then I realized I needed a specific file with the map information. Google lead me to @diegovalle who has created the map from official Mexican sources, downloaded the homicide data, cleaned it, and made several maps and analyses: all his work is very impressive! I thought that it’d be very cool if @diegovalle and Ramnath connected, and they did! I saw them interacting via Twitter (here and here) and via GitHub. After sharing @diegovalle’s work with my friends, it turned out that some old friends already knew him (here and high school friends). Another friend was interested in additional features and I suggested her to contact @diegovalle via Twitter: he quickly replied as you can see here.\nBeyond how impressive rMaps and @diegovalle’s work on mexican data are, I was amazed by the willingness to help each other and how great people easily connected. I believe this is one of the great features of both GitHub and Twitter where you can share your code, ask questions, try to answer them, meet people working with your tools, etc. You can even offer to PayPal a beer like @tyokota did.\nAfter all their great work, now someone like me (aka, without knowing javascript, Datamaps, etc) can walk you through an example of making an interactive choropleth map showing the homicides rates in Mexico from 1997 to 2013.\nHomicides rates in Mexico 1997-2013 The first thing we need to make a custom map using rMaps is a topojson file which in this case specifies the mexican states boundaries. This process is explained in more detail by @tyokota at custom-map which you can view here.\nIn this particular example, INEGI which is the National Institute of Statistics and Geography of Mexico has a map of the mexican states. @diegovalle explained how to download it here.\nBut before doing so, you might to install topojson like I did below following the installation instructions. In the terminal:\n## Install node.js following instructions at https://github.com/mbostock/topojson/wiki/Installation brew install node ## Install topojson npm install -g topojson ## Download map info from INEGI (Mexican official source) curl -o estados.zip http://mapserver.inegi.org.mx/MGN/mge2010v5_0.zip ## Decompress file unzip estados.zip ## Create shapefile ogr2ogr states.shp Entidades_2010_5.shp -t_srs \u0026#34;+proj=longlat +ellps=WGS84 +no_defs +towgs84=0,0,0\u0026#34; ## id-property needed so that DataMaps knows how to color the map topojson -o mx_states.json -s 1e-7 -q 1e5 states.shp -p state_code=+CVE_ENT,name=NOM_ENT --id-property NOM_ENT Now that we have the topojson file mx_states.json we need to get the actual homicide data. @diegovalle has gone through the whole process of acquiring the data from official mexican sources and cleaning it. Lets download it.\n# Download crime data ## From crimenmexico.diegovalle.net/en/csv ## All local crimes at the state level download.file(\u0026#34;http://crimenmexico.diegovalle.net/en/csv/fuero-comun-estados.csv.gz\u0026#34;, \u0026#34;fuero-comun-estados.csv.gz\u0026#34;) The data is not completely ready for us to use it and we need to reshape it a bit. In particular, we want to consider only the intentional homicides and group the data by state and date. We can get this to work by using dplyr (Wickham \u0026amp; Francois, 2014).\n## Load required packages library(\u0026#34;dplyr\u0026#34;) ## Load the crime data crime \u0026lt;- read.csv(\u0026#34;fuero-comun-estados.csv.gz\u0026#34;) ## Only intentional homicides crime \u0026lt;- subset(crime, crime == \u0026#34;HOMICIDIOS\u0026#34; \u0026amp; type == \u0026#34;DOLOSOS\u0026#34;) ## Sum homicides by firearm, etc and group by state and date hom \u0026lt;- crime %.% filter(year %in% 1997:2013) %.% group_by(state_code, year, type) %.% summarise(total = sum(count, na.rm = TRUE), population = mean(population) ) %.% mutate(rate = total / population * 10^5) %.% arrange(state_code, year) ## How are states coded? summary(hom$state_code) ## Min. 1st Qu. Median Mean 3rd Qu. Max. ## 1.00 8.75 16.50 16.50 24.20 32.00 We have the slight inconvenience that states are coded as integers from 1 to 32 instead of using their names. Using another of the files supplied by @diegovalle we can merge the codes. This requires using the foreign (R Core Team) package for loading a dbf file and then merging both data sets with plyr (Wickham, 2011).\n## Needed for read.dbf library(\u0026#34;foreign\u0026#34;) ## The dbf from the state shapefile needed to merge state_code with state ## names codes \u0026lt;- read.dbf(\u0026#34;states.dbf\u0026#34;) codes$NOM_ENT \u0026lt;- iconv(codes$NOM_ENT, \u0026#34;windows-1252\u0026#34;, \u0026#34;utf-8\u0026#34;) codes$CVE_ENT \u0026lt;- as.numeric(codes$CVE_ENT) codes$OID \u0026lt;- NULL names(codes) …","date":1393372800,"expirydate":-62135596800,"kind":"page","lang":"en","lastmod":1741387190,"objectID":"83d1c670da1dc210fb507e5ee24da5b5","permalink":"https://lcolladotor.github.io/2014/02/26/rmaps-mexico-map/","publishdate":"2014-02-26T00:00:00Z","relpermalink":"/2014/02/26/rmaps-mexico-map/","section":"post","summary":"It’s exciting when great people help each other get things done This is a simple networking story, which might not be surprising to some but I was happily surprised by it.","tags":["Network"],"title":"rMaps Mexico map","type":"post"},{"authors":null,"categories":["rstats"],"content":"Thanks to Alyssa Frazee I just learned about the colorout package (Aquino, 2013). It modifies R so that the output is in different colors, making it much more pleasant to use R in the terminal.\nDo note that colorout is not available from CRAN, but you can easily install by following the instructions on the colorout site (Official site) reproduced below:\ndownload.file(\u0026#34;http://www.lepem.ufc.br/jaa/colorout_1.0-2.tar.gz\u0026#34;, destfile = \u0026#34;colorout_1.0-2.tar.gz\u0026#34;) install.packages(\u0026#34;colorout_1.0-2.tar.gz\u0026#34;, type = \u0026#34;source\u0026#34;, repos = NULL) The next step is to then load colorout automatically when I start R. The problem is that I don’t use R solely on the terminal. I easily figured out how to do so thanks to the error message you get when attempting to load colorout on the R GUI. I thus ended up adding the following lines to my .Rprofile (both locally and in the cluster):\n## Change colors when running R in the terminal if (Sys.getenv(\u0026#34;TERM\u0026#34;) == \u0026#34;xterm-256color\u0026#34;) library(\u0026#34;colorout\u0026#34;) Now I have pretty R output in the terminal! Thanks again Alyssa! See her original tweet below:\nproblem: R output in Terminal isn\u0026#39;t colorful. SOLUTION: http://t.co/Vd6OoRoUU5\n— Alyssa Frazee (@acfrazee) February 17, 2014 colorout has been around for a while and was even at CRAN for some time. I guess that I’m just late to the party.\nIf the default colorout colors don’t work for you, check functions such as setOutputColors256. This post shows how you can do it and includes screenshots of the output. Other package details are included here and here.\nReferences Citations made with knitcitations (Boettiger, 2014).\nJakson Aquino, (2013) colorout: Colorize R output on terminal emulators. http://www.lepem.ufc.br/jaa/colorout.html colorout. http://www.lepem.ufc.br/jaa/colorout.html Carl Boettiger, (2014) knitcitations: Citations for knitr markdown files. http://CRAN.R-project.org/package=knitcitations Reproducibility sessionInfo() ## R version 3.0.2 (2013-09-25) ## Platform: x86_64-apple-darwin10.8.0 (64-bit) ## ## locale: ## [1] en_US.UTF-8/en_US.UTF-8/en_US.UTF-8/C/en_US.UTF-8/en_US.UTF-8 ## ## attached base packages: ## [1] stats graphics grDevices utils datasets methods base ## ## other attached packages: ## [1] knitcitations_0.5-0 bibtex_0.3-6 knitr_1.5 ## ## loaded via a namespace (and not attached): ## [1] codetools_0.2-8 digest_0.6.4 evaluate_0.5.1 formatR_0.10 ## [5] httr_0.2 RCurl_1.95-4.1 stringr_0.6.2 tools_3.0.2 ## [9] XML_3.95-0.2 xtable_1.7-1 Check other topics on #rstats.\n","date":1392595200,"expirydate":-62135596800,"kind":"page","lang":"en","lastmod":1741387190,"objectID":"7e20a5bf5ef7866a0f000531a5d0e637","permalink":"https://lcolladotor.github.io/2014/02/17/automatically-coloring-your-r-output-in-the-terminal-using-colorout/","publishdate":"2014-02-17T00:00:00Z","relpermalink":"/2014/02/17/automatically-coloring-your-r-output-in-the-terminal-using-colorout/","section":"post","summary":"Thanks to Alyssa Frazee I just learned about the colorout package (Aquino, 2013). It modifies R so that the output is in different colors, making it much more pleasant to use R in the terminal.","tags":["Fun"],"title":"Automatically coloring your R output in the terminal using colorout","type":"post"},{"authors":null,"categories":["rstats"],"content":"Ramnath Vaidyanathan just released his new R interactive package, rMaps (Vaidyanathan, 2014). The packages relies on the development version of his widely known rCharts package (Vaidyanathan, 2013) as well as javascript libraries that specialize in maps. If you don’t know Ramnath, he is one of the most active R developers out there!! You can see that from his GitHub profile.\nThe package is very new and still under development, but I bet that Ramnath released it to get us users excited and maybe find some helpful hands to document it and further develop it.\nI don’t know about you, but I surely got excited about the package from his intro video:\nIt’s a simple screen cast with good music.\nIn the GitHub rMaps repository you can find the simple installation instructions as well as three different examples. They all work if you run them in the latest version of RStudio otherwise you might run into a couple minor hiccups like I did.\nJust to get you excited, this is the third example where you can easily add markers with pop ups.\nsuppressMessages(library(\u0026#34;rMaps\u0026#34;)) map \u0026lt;- Leaflet$new() map$setView(c(51.505, -0.09), zoom = 13) map$tileLayer(provider = \u0026#34;Stamen.Watercolor\u0026#34;) map$marker(c(51.5, -0.09), bindPopup = \u0026#34;Hi. I am a popup\u0026#34;) map You can view the interactive version of the example here – I’m sure that a feature will be added later to make it easy to share the maps you make.\nOverall, I think that this is a great start and I look forward to using it. For now, don’t be discouraged with the lack of documentation. I’m sure that if you ask nicely Ramnath will answer asap!\nReferences Citations made with knitcitations (Boettiger, 2014).\nCarl Boettiger, (2014) knitcitations: Citations for knitr markdown files. http://CRAN.R-project.org/package=knitcitations Ramnath Vaidyanathan, (2013) rCharts: Interactive Charts using Polycharts.js. Ramnath Vaidyanathan, (2014) rMaps: Interactive Maps from R. Reproducibility sessionInfo() ## R version 3.0.2 (2013-09-25) ## Platform: x86_64-apple-darwin10.8.0 (64-bit) ## ## locale: ## [1] en_US.UTF-8/en_US.UTF-8/en_US.UTF-8/C/en_US.UTF-8/en_US.UTF-8 ## ## attached base packages: ## [1] stats graphics grDevices utils datasets methods base ## ## other attached packages: ## [1] rMaps_0.1 knitcitations_0.5-0 bibtex_0.3-6 ## [4] knitr_1.5 ## ## loaded via a namespace (and not attached): ## [1] codetools_0.2-8 digest_0.6.4 evaluate_0.5.1 ## [4] formatR_0.10 grid_3.0.2 httr_0.2 ## [7] lattice_0.20-24 plyr_1.8 rCharts_0.4.2 ## [10] RColorBrewer_1.0-5 RCurl_1.95-4.1 RJSONIO_1.0-3 ## [13] stringr_0.6.2 tools_3.0.2 whisker_0.3-2 ## [16] XML_3.95-0.2 xtable_1.7-1 yaml_2.1.10 Check other topics on #rstats.\n","date":1391990400,"expirydate":-62135596800,"kind":"page","lang":"en","lastmod":1741387190,"objectID":"30fe1f140283349719097016f4060a21","permalink":"https://lcolladotor.github.io/2014/02/10/rmaps-released/","publishdate":"2014-02-10T00:00:00Z","relpermalink":"/2014/02/10/rmaps-released/","section":"post","summary":"Ramnath Vaidyanathan just released his new R interactive package, rMaps (Vaidyanathan, 2014). The packages relies on the development version of his widely known rCharts package (Vaidyanathan, 2013) as well as javascript libraries that specialize in maps.","tags":["Fun"],"title":"rMaps released","type":"post"},{"authors":null,"categories":["rstats"],"content":"Have you ever wondered whether you can upload files from R to Dropbox and/or Google Docs? I recently asked myself this question while making my most recent Shiny app (more later).\nThe answer is yes, you can upload files from R to these cloud services!\nDropbox As far as I know, the best R package for uploading files to Dropbox is rDrop (Ram \u0026amp; Temple Lang, 2012). The whole setup is very well explained in it’s GitHub repository (Karthik). Basically you have to:\nInstall the package and it’s dependencies (some are only on GitHub). Create a Dropbox app in your account. Get the credentials info. Authorize your access to the Dropbox app from R. Save that info for later use. dropbox_save() Then uploading any type of R object to Dropbox becomes as easy as using the dropbox_save() function.\nFor example, lets save a simple vector with random data.\nsuppressMessages(library(\u0026#34;rDrop\u0026#34;)) ## Define credentials or load them if you defined them already ## dropbox_credentials \u0026lt;- dropbox_auth(\u0026#39;Your app key\u0026#39;, \u0026#39;Your app secret\u0026#39;) load(\u0026#34;dropbox_credentials.Rdata\u0026#34;) ## Lets create some random data set.seed(20140205) x \u0026lt;- rnorm(1000) ## Lets check the args of the uploading function args(dropbox_save) ## function (cred, ..., list = character(), file = stop(\u0026#34;\u0026#39;file\u0026#39; must be specified\u0026#34;), ## envir = parent.frame(), precheck = TRUE, verbose = FALSE, ## curl = getCurlHandle(), ext = \u0026#34;.rda\u0026#34;, .opts = list()) ## NULL ## Then lets upload it to dropbox on the public folder done \u0026lt;- dropbox_save(dropbox_credentials, x, file = \u0026#34;public/x\u0026#34;) ## The result has some information, like the path of where you upload the ## file names(done) ## [1] \u0026#34;revision\u0026#34; \u0026#34;rev\u0026#34; \u0026#34;thumb_exists\u0026#34; \u0026#34;bytes\u0026#34; ## [5] \u0026#34;modified\u0026#34; \u0026#34;client_mtime\u0026#34; \u0026#34;path\u0026#34; \u0026#34;is_dir\u0026#34; ## [9] \u0026#34;icon\u0026#34; \u0026#34;root\u0026#34; \u0026#34;mime_type\u0026#34; \u0026#34;size\u0026#34; done$path ## [1] \u0026#34;/public/x.rda\u0026#34; You can now actually download the “x.rda” file from here. That’s in case that you also wanted to share the file, and is obviously optional.\nNote that you can get the link from withing R and don’t even need to use the Dropbox site.\ndropbox_share(dropbox_credentials, file = \u0026#34;public/x.rda\u0026#34;) ## $url ## [1] \u0026#34;https://db.tt/xzf3huXf\u0026#34; ## ## $expires ## [1] \u0026#34;Tue, 01 Jan 2030 00:00:00 +0000\u0026#34; dropbox_put() What if you want to upload an actual file and not only R objects? That’s where dropbox_put() shines. Below is an example where we create an image, save it as a pdf file, and upload it to Dropbox.\n## Lets create a sample file, in this case a pdf file pdf(\u0026#34;dropboxFig.pdf\u0026#34;) hist(x, freq = FALSE, col = \u0026#34;light blue\u0026#34;) tmp \u0026lt;- dev.off() ## Lets check the args for the uploading function args(dropbox_put) ## function (cred, what, filename = what, curl = getCurlHandle(), ## ..., verbose = FALSE, contentType = \u0026#34;application/octet-stream\u0026#34;) ## NULL ## Now, lets upload the file done \u0026lt;- dropbox_put(dropbox_credentials, what = \u0026#34;dropboxFig.pdf\u0026#34;, filename = \u0026#34;public/dropboxFig.pdf\u0026#34;) ## Again, the result contains some information about the file names(done) ## [1] \u0026#34;revision\u0026#34; \u0026#34;rev\u0026#34; \u0026#34;thumb_exists\u0026#34; \u0026#34;bytes\u0026#34; ## [5] \u0026#34;modified\u0026#34; \u0026#34;client_mtime\u0026#34; \u0026#34;path\u0026#34; \u0026#34;is_dir\u0026#34; ## [9] \u0026#34;icon\u0026#34; \u0026#34;root\u0026#34; \u0026#34;mime_type\u0026#34; \u0026#34;size\u0026#34; You can view the result here.\nGoogle Docs From what I found, it seems to me that RGoogleDocs (Temple Lang) is the package you’ll want to use for interacting with Google Docs from R. The manual (Temple Lang) explains all what you pretty much need to know. You should know though that you can only upload certain types of files.\nFor example, you can upload a text file as shown below.\nsuppressMessages(library(\u0026#34;RGoogleDocs\u0026#34;)) ## Load password load(\u0026#34;gpasswd.Rdata\u0026#34;) ## Something to write text \u0026lt;- \u0026#34;Hello world!\\n\u0026#34; ## Authentificate auth \u0026lt;- getGoogleAuth(\u0026#34;[email protected]\u0026#34;, gpasswd) ## Connect to Google con \u0026lt;- getGoogleDocsConnection(auth) ## Check the args for the uploading function args(uploadDoc) ## function (content, con, name, type = as.character(findType(content)), ## binary = FALSE, asText = FALSE, folder = NULL, replace = TRUE, ## ...) ## NULL ## Upload the file done \u0026lt;- uploadDoc(content = text, con = con, name = \u0026#34;testFile.txt\u0026#34;, type = \u0026#34;txt\u0026#34;) You can view the file here.\nConclusions rDrop (Ram \u0026amp; Temple Lang, 2012) is very cool and easy to use. Compared to Google Docs, you have much greater flexibility on the type of files you can upload. I guess that will change in the future if there is a Google Drive from R package.\nReferences Citations made with knitcitations (Boettiger, 2014).\nkarthik, karthik/rDrop. GitHub https://github.com/karthik/rDrop An simple R interface to Google Documents. http://www.omegahat.org/RGoogleDocs/run.html Carl Boettiger, (2014) knitcitations: Citations for knitr markdown files. http://CRAN.R-project.org/package=knitcitations Karthik Ram, Duncan Temple Lang, (2012) rDrop: Dropbox R interface.. http://github.com/karthikram/rDrop Duncan Lang, RGoogleDocs: Primitive interface to Google Documents from R. Reproducibility sessionInfo() ## R version 3.0.2 (2013-09-25) ## Platform: x86_64-apple-darwin10.8.0 (64-bit) ## ## locale: ## [1] …","date":1391558400,"expirydate":-62135596800,"kind":"page","lang":"en","lastmod":1741387190,"objectID":"25468bcea588dca2e85b8f350c51c80a","permalink":"https://lcolladotor.github.io/2014/02/05/how-to-upload-files-to-dropbox-and-google-docs-from-r/","publishdate":"2014-02-05T00:00:00Z","relpermalink":"/2014/02/05/how-to-upload-files-to-dropbox-and-google-docs-from-r/","section":"post","summary":"Have you ever wondered whether you can upload files from R to Dropbox and/or Google Docs? I recently asked myself this question while making my most recent Shiny app (more later).","tags":["Google","Dropbox"],"title":"How to upload files to Dropbox and Google Docs from R","type":"post"},{"authors":["Leonardo Collado-Torres"],"categories":null,"content":" ","date":1388880000,"expirydate":-62135596800,"kind":"page","lang":"en","lastmod":1621020950,"objectID":"945c2c25ae46859c25e027be14440166","permalink":"https://lcolladotor.github.io/talk/lcg2014/","publishdate":"2014-01-05T00:00:00Z","relpermalink":"/talk/lcg2014/","section":"talk","summary":"derfinder overview for the LCG 10 year anniversary symposium","tags":["derfinder","LCG"],"title":"Fast differential expression analysis annotation-agnostic across groups with biological replicates","type":"talk"},{"authors":null,"categories":["Computing"],"content":"To be able to do RNA-seq research work in large multi-sample studies you have to be able to analyze large files and thus frequently use a powerful computing environment. In my case, this means that I have to login to a computing cluster frequently. This is a common task for other biostatisticians (like those that do brain imagining studies) and many other people. When I am working on a project, I generally have to login to the cluster and then change the directory to the location where I have my project files.\nA local cluster is normally composed of a login machine (enigma2 in my case) from where you can request to work on a node. There are several options for controlling this process of requesting a node, and in our institution we use a Sun/Oracle Grid Engine. When a cluster has a lot of users, you want to dedicate the login machine as much as possible to handling login requests and assigning nodes for people to use. This means that you want to minimize doing any other kind of operations on the login machine, such as input/output operations.\nBasic workflow This means that the steps I normally follow before getting to work on my project are:\n## Open the terminal ## Login to enigma ssh [email protected] ## Request a node to work on interactively qrsh ## Change to the directory where I have my project files cd projectDir ## Done! For a long time I have used an alias for the login step. I have this alias in my local .bashrc file:\n## In local .bashrc file alias enigma=\u0026#34;ssh [email protected]\u0026#34; Thus saving a tiny bit of typing:\n## Open terminal ## Login to enigma enigma ## Etc qrsh cd projectDir When the projectDir gets complicated, I make an alias on my .bashrc file on the cluster. For example:\n## In cluster .bashrc file alias pdir=\u0026#34;cd /very/complicated/path/to/projectDir/\u0026#34; And finally, I can accomplish the setup task with minimal typing:\n## Open terminal enigma qrsh pdir Using ssh config This section was added after Kasper Hansen’s comment.\nYou can edit the ~.ssh/config file (check how to set it up, explained differently and the manual) to make things even better. This is how mine looks like:\nHost enigma User username Hostname enigma2.etc.edu ForwardX11 yes I like the ssh -X (or -Y) option so I can later view plots in X11 when running R. That is why the ForwardX11 option is present.\nThen you can use the following command to ssh into the cluster.\nssh enigma Or if you prefer, simplify the bash alias to:\n## In local .bashrc file alias enigma=\u0026#34;ssh enigma\u0026#34; The sections below have been edited to assume that you are configured the enigma host shortcut in your ~.ssh/config file.\nNeeded a new strategy The previous strategy works and I had been very comfortable with it. However, at times you might forget to request a node from the cluster to do your work interactively. This is specially true for me when I only plan on using a few git commands. But when many users forget this, it becomes a problem and our cluster manager had to send us a reminder:\n*ALWAYS* work on a cluster node rather than on enigma2. Enigma2 is a *single machine* with many people trying to use it to gain access to the cluster. Even for tar commands, cp commands, wc commands ... first qrsh to a node. Profiles in iTerm2 Just a few days after we got this reminder, I decided to take a look at the iTerm2 profile menu. There are plenty of options for customizing your terminal, but the ones I mainly ended up using are:\nWorking directory -\u0026gt; Directory : -\u0026gt; choose a directory in my laptop. Generally the location of my git repository for version controlling the code of a given project. Command -\u0026gt; Send text at start -\u0026gt; an alias from my local .bashrc file as shown in the image below (the alias is qr). The first case above is nice, but the real power comes from the second case. Since I can pretty much evaluate any command, I asked myself if I could set up a profile that automatically logs in to the cluster? Can it also request a node interactively? And even go to my project directory?\ncluster qr alias I then remembered that Samuel Younkin explained to us how to set up qrsh to automatically change the directory to the directory from which you invoked qrsh (Younkin, 2013). I modified things a little bit and saved this qrsh version as the qr alias on the cluster:\n## In cluster .bashrc file ## change dir automatically when using qrsh ## Details: https://github.com/rkostadi/BiocHopkins/wiki/Useless-Tips-\u0026amp;-Code-Snippets if [ -f ~/.bash_pwd ]; then source ~/.bash_pwd rm ~/.bash_pwd fi alias qr=\u0026#39;echo \u0026#34;cd $PWD\u0026#34; \u0026gt; ~/.bash_pwd; history -w; qrsh\u0026#39; Note that I tried using the qrsh -ac option, but couldn’t get to pass a variable. Doing so in theory would remove the need to create the .bash_pwd temporary file.\nssh and change dir in one command Then googling I found how to ssh and change directory in one command (Frosty, 2009):\nssh -t enigma \u0026#39;cd /very/complicated/path/to/projectDir/; bash\u0026#39; The problem I soon encountered was that I couldn’t qrsh right after because the …","date":1386720000,"expirydate":-62135596800,"kind":"page","lang":"en","lastmod":1741387190,"objectID":"4bd20126be65052787a88a1b75201e5e","permalink":"https://lcolladotor.github.io/2013/12/11/login-to-the-cluster-request-a-node-and-change-to-your-project-directory-in-a-single-command/","publishdate":"2013-12-11T00:00:00Z","relpermalink":"/2013/12/11/login-to-the-cluster-request-a-node-and-change-to-your-project-directory-in-a-single-command/","section":"post","summary":"To be able to do RNA-seq research work in large multi-sample studies you have to be able to analyze large files and thus frequently use a powerful computing environment. In my case, this means that I have to login to a computing cluster frequently.","tags":["cluster"],"title":"Login to the cluster, request a node and change to your project directory in a single command","type":"post"},{"authors":null,"categories":["rstats"],"content":"As a biostatistics student, I use R very frequently when analyzing data. At the same time, I interact with other researchers, some who know how to use R (R crowd) and some who don’t (yet!): no-R crowd. This means that I have to be able to communicate my results to two crowds. It is important that I can quickly provide the code in case that the R savvy want to look at it: maybe they find a bug and report it ^^. Ideally I want to avoid having to write (organize, share, etc) two crowd-specific reports.\nA solution to this problem is to create reproducible reports that contain the R code, the results, and interpretation. For the specific scenario I am talking about, reproducibility is a plus, however I believe that it is important for research; albeit not the topic of this post. One of the strongest packages out there to create such reports is knitr (Xie, 2013). It is specially easy to create Rmd files from which you can generate HTML reports. Then using RStudio you can share them via RPubs, a private folder on Dropbox, etc. From example, this is a presentation without the slide formatting I shared more than a year ago.\nUsing knitr (Xie, 2013) is definitely a step in the right direction. However, you soon find yourself desiring a better template. This is where knitrBootstrap (Hester, 2013) comes in. This package was initialized in March 20th, 2013 by Jim Hester and hosted on it’s GitHub repository. I was sold on the idea early on and I am now making this post in part as a tribute to celebrate that it has been available via CRAN for nearly 5 months now.\nSo what can you do with knitrBootstrap (Hester, 2013)? In my opinion, you get the ideal solution (or very close at the least) to the problem I described at the beginning. Basically, you get a HTML report that has the interpretation and results which is what the no-R crowd wants to read, and the R code easily available at the click of a button for the R crowd. In addition, the report is much more nicely formatted which is pleasant to the eye. Furthermore, a menu with the sections is included which is very useful when navigating the report and for jumping to specific sections. To save space, the plots are saved as thumbnails and you can click on them to get the full view. Finally, you can choose to display toggle menus for allowing the users to change the default text and code formatting.\nHow do you use this package? The main workhorse is the knit_boostrap() function. The initial arguments are similar to those you find in knitr::knit() while the new features are controlled using:\nboot_style You can select out of 11 or so options for the default formatting. Basically, you choose one of the Bootstrap themes available. code_style Similar to boot_style but for controlling the appearance of the code chunks. chooser Allows you to control if you want a toggle menu so the user can choose (hence the name) the bootstrap and/or code styles. thumbsize For controlling the size of figure thumbnails. show_code Whether by default the code is shown. I set this to FALSE in order to get a report that by default is accessible for the no-R crowd. The R crowd can then click to see the code for each code chunk or use the menu on the bottom to show all the code at once. show_output Similar to show_code but for controlling the visibility of the output produced from the code. I set this to TRUE as you normally want to show the output to both the no-R and R crowds. show_figure Whether you want to show the plots or not. graphics Used only for controlling the toggle menus for the bootstrap and code styles. Once you have decided which options you want to use, it is as simple as running the following code for your Rmd file (named file.Rmd in the example):\n## Install if needed install.packages(\u0026#34;knitrBootstrap\u0026#34;) ## knit with knitrBootstrap library(\u0026#34;knitrBootstrap\u0026#34;) knit_bootstrap(\u0026#34;file.Rmd\u0026#34;, code_style = \u0026#34;Brown Paper\u0026#34;, chooser = c(\u0026#34;boot\u0026#34;, \u0026#34;code\u0026#34;), show_code = FALSE) Things get a tiny bit more complicated if you want to use RStudio. You basically have to modify your .Rprofile file, then load RStudio and change the settings to weave files with knitrinstead of using Sweave. Then, you have to use knitr::render_html() on the Rmd file itself. Below is a short example of the .Rprofile modified to use knitrBootstrap and the basic Rmd example.\nYou can view the final output here. Note that you might need to click on “hide toolbars” (a RPubs option) to clearly view the menus on the bottom.\nIf you are like me and use Textmate as your text editor, you can knit the Rmd files with knitrBootstrap and preview them directly on the Textmate viewr using a command like this (modified from the SWeave bundle):\nOther usage options are described in the knitrBootstrap help page.\nTo close off, let me emphasize how useful it is to be able to generate a single report that is pleasant to the eye, contains all the information, and is easily sharable for both the R and no-R crowds. Plus it’s reproducible!\nI really like this …","date":1386633600,"expirydate":-62135596800,"kind":"page","lang":"en","lastmod":1741387190,"objectID":"60bf06ae56900c8dbd01a67d3b0b2580","permalink":"https://lcolladotor.github.io/2013/12/10/creating-awesome-reports-for-multiple-audiences-using-knitrbootstrap/","publishdate":"2013-12-10T00:00:00Z","relpermalink":"/2013/12/10/creating-awesome-reports-for-multiple-audiences-using-knitrbootstrap/","section":"post","summary":"As a biostatistics student, I use R very frequently when analyzing data. At the same time, I interact with other researchers, some who know how to use R (R crowd) and some who don’t (yet!","tags":["knitr","html"],"title":"Creating awesome reports for multiple audiences using knitrBootstrap","type":"post"},{"authors":null,"categories":["JHU Biostat","Fun"],"content":" Note: the Fall event will be student and post doc only while the Spring event will be open to the whole department. This is to smooth the integration process for the new students. A survey showed that at least some first year students would be more likely to either attend or present if it’s a student-only event.\n","date":1384905600,"expirydate":-62135596800,"kind":"page","lang":"en","lastmod":1741387190,"objectID":"91ca1dd283d73ed2c97225b691e9f0a5","permalink":"https://lcolladotor.github.io/2013/11/20/third-student-cultural-mixer/","publishdate":"2013-11-20T00:00:00Z","relpermalink":"/2013/11/20/third-student-cultural-mixer/","section":"post","summary":"Note: the Fall event will be student and post doc only while the Spring event will be open to the whole department. This is to smooth the integration process for the new students.","tags":["Fun"],"title":"Third Student Cultural Mixer","type":"post"},{"authors":null,"categories":["rstats"],"content":"I am currently trying to understand how to reduce the memory used by mclapply. This function is rather complicated and others have explained the differences versus parLapply (A_Skelton73, 2013; lockedoff, 2012 ) and also made it clear that in mclapply each job does not know if the others are running out of memory and thus cannot trigger gc (Urbanek, 2012).\nWhile I still struggle to understand all the details of mclapply, I can successfully use it to reduce computation time at the expense of a very high memory load. I am still looking for tips on how to reduce this memory load.\nHere is what I have done.\nProblem setting I have a large data set on the form of a data.frame. I want to apply a function that works using subsets of the data.frame without the need for communication between the chunks, and I want to apply the function fast. In other words, I can safely split the matrix and speed the computation process using mclapply.\nWhile this works, I would like to minimize memory consumption.\nToy data Here is just some toy data for the example.\n## The real data set is much larger than this set.seed(20131113) data \u0026lt;- data.frame(matrix(rnorm(1e+05), ncol = 10)) dim(data) ## [1] 10000 10 Approach 1 The first approach I have used is to pre-split the data and then use mclapply over the split data. For illustrative purposes, lets say that the function I want to apply is just rowMeans.\n## Pre-split the data dataSplit \u0026lt;- split(data, rep(1:10, each = 1000)) ## Approach 1 library(\u0026#34;parallel\u0026#34;) res1 \u0026lt;- mclapply(dataSplit, rowMeans, mc.cores = 2) This gets the job done, but because my real dataSplit is much larger in memory, using say 8-10 cores blows up the memory.\nBest way to pre-split? If I know that if I am using \\( n \\) number of cores (in this example \\( n=2 \\) ) and the data set has \\( m \\) rows, then one option for approach #1 is to split the data into \\( n \\) chunks each of size \\( m / n \\) (rounding if needed).\n## Pre-split the data into m/n chunks dataSplit1b \u0026lt;- split(data, rep(1:2, each = 5000)) ## Approach 1b res1b \u0026lt;- mclapply(dataSplit1b, rowMeans, mc.cores = 2) The memory needed is then in part determined by the chunksize (1000 vs 5000 shown above). One excellent suggestion (via Ben) is to reduce the memory load using this approach is to just smaller chunks. However, the runtime of the function I want to apply (rowMeans in the example) is not very sensible to the chunksize used, thus using very small chunks is not ideal as it increases computation time. Finding the sweet point is tricky, but using chunksizes of \\(m / (2n) \\) could certainly help memory wise without majorly affecting computation time.\nApproach 2 One suggestion (via Roger) is to use an environment in order to minimize copying (and thus memory load) while using mclapply over a set of indexes.\n## Save the split data in an environment my.env \u0026lt;- new.env() my.env$data1 \u0026lt;- dataSplit1b[[1]] my.env$data2 \u0026lt;- dataSplit1b[[2]] ## Function that takes indexes, then extracts the data from the environment applyMyFun \u0026lt;- function(idx, env) { eval(parse(text = paste0(\u0026#34;result \u0026lt;- env$\u0026#34;, ls(env)[idx]))) rowMeans(result) } ## Approach 2 index \u0026lt;- 1:2 names(index) \u0026lt;- 1:2 res2 \u0026lt;- mclapply(index, applyMyFun, env = my.env, mc.cores = 2) ## Same result? identical(res1b, res2) ## [1] TRUE Approach 3 Another suggestion (via Roger) is to save the data chunks and load them individually inside the function that I pass to mclapply. This does not seem ideal in terms of having to create the temporary chunk data files. But I would expect this method to have the lowest memory footprint.\n## Save the chunks for (i in names(dataSplit1b)) { chunk \u0026lt;- dataSplit1b[[i]] output \u0026lt;- paste0(\u0026#34;chunk\u0026#34;, i, \u0026#34;.Rdata\u0026#34;) save(chunk, file = output) } ## Function that loads the chunk applyMyFun2 \u0026lt;- function(idx) { load(paste0(\u0026#34;chunk\u0026#34;, idx, \u0026#34;.Rdata\u0026#34;)) rowMeans(chunk) } ## Approach 3 res3 \u0026lt;- mclapply(index, applyMyFun2, mc.cores = 2) ## Same result? identical(res1b, res3) ## [1] TRUE Computation time comparison Computation time wise, approaches 2 and 3 do not seem very different. Approach 1b seems a tiny bit faster. [Edit: the order of the best approach might change slightly if you re-run this code]\nlibrary(\u0026#34;microbenchmark\u0026#34;) micro \u0026lt;- microbenchmark(mclapply(dataSplit1b, rowMeans, mc.cores = 2), mclapply(index, applyMyFun, env = my.env, mc.cores = 2), mclapply(index, applyMyFun2, mc.cores = 2)) micro ## Unit: milliseconds ## expr min lq ## mclapply(dataSplit1b, rowMeans, mc.cores = 2) 17.43 19.97 ## mclapply(index, applyMyFun, env = my.env, mc.cores = 2) 17.05 19.20 ## mclapply(index, applyMyFun2, mc.cores = 2) 17.19 23.11 ## median uq max neval ## 21.41 26.00 65.53 100 ## 20.60 23.92 43.67 100 ## 24.56 28.39 46.99 100 library(\u0026#34;ggplot2\u0026#34;) autoplot(micro) Memory wise comparison Relying on the cluster tools for calculating the maximum memory used, I ran each approach (1b, 2, and 3) ten times each using 2 cores using the scripts available in this gist. The maximum memory used showed no variability (within an …","date":1384387200,"expirydate":-62135596800,"kind":"page","lang":"en","lastmod":1741387190,"objectID":"6ca48f0a32e4ccf102c06c1bd5480ede","permalink":"https://lcolladotor.github.io/2013/11/14/trying-to-reduce-the-memory-overhead-when-using-mclapply/","publishdate":"2013-11-14T00:00:00Z","relpermalink":"/2013/11/14/trying-to-reduce-the-memory-overhead-when-using-mclapply/","section":"post","summary":"I am currently trying to understand how to reduce the memory used by mclapply. This function is rather complicated and others have explained the differences versus parLapply (A_Skelton73, 2013; lockedoff, 2012 ) and also made it clear that in mclapply each job does not know if the others are running out of memory and thus cannot trigger gc (Urbanek, 2012).","tags":["Help","parallel"],"title":"Trying to reduce the memory overhead when using mclapply","type":"post"},{"authors":null,"categories":["Web","rstats"],"content":"As you might have noticed, I recently decided to move Fellgernon Bit from Tumblr to GitHub. There are a couple of reasons why I made this change.\nI wanted a more professional-looking blog. There are not many R blogs on Tumblr, and well, long text posts are not really meant for Tumblr. Better code highlighting. I had enabled R code highlighting using the highlighting instructions from Jeffrey Horner (Horner, Part I). The instructions are great! I guess I just got lazy to tweak the CSS of my Tumblr blog to fix some things I didn’t like. I also want to be able to highlight code from other languages, like bash. Make it easier to embed any HTML code. Yes, you can write posts at Tumblr in pure HTML but sometimes things break as Tumblr doesn’t like them. Easier process of writing posts using Rmd files. The steps in Horner’s guide (Horner, Part II) are quite involved. Instead of those steps, I was just knitting my posts and then manually copying the html code in the body tags, then pasting it in Tumblr. Easy way to host figures and link to them. I have previously hosted pictures through Picasa Web Albums, but with the push towards Google Plus they made it harder to embed solo pictures (you can embed Google+ posts though). I had also previously heard about Jekyll-powered blogs, specially thanks to Yihui Xie’s blog (Xie, English version). At the time when I first learned about this type of blog it seemed challenging so I never dedicated the time to really learn about it. What ended up movitivating me to do so was our new student bloggers group @jhubiostat.\nLet me describe how I set up Fellgernon Bit @ GitHub.\nSetting up Fellgernon Bit @ GitHub Creating the Jekyll-Bootstrap blog My main guide to setup the blog comes from a post by J. Fisher (Fisher, 2012) which points to another of his posts (Fisher, 2012b).\nInstall Jekyll Before doing anything, I first had to install Jekyll. To do so I recommend checking the installation documentation (Jekyll Installation).\nTo install Jekyll, I needed to have Ruby and RubyGems. Since I use MacPorts these are the steps I used:\n## Update MacPorts, can take a while!! sudo port selfupdate sudo port upgrade outdated ## Search for Ruby and install it ## I think that Jekyll needs 1.9+ since I had 1.8 already installed port search ruby sudo port install ruby19 ## Set as default version sudo port select --set ruby ruby19 ## Check which version you have ruby --version ## I manually set mine to be ruby1.9 cd /opt/local/bin sudo ln -s ruby1.9 ruby ruby --version ## This is mine: ## ruby 1.9.3p448 (2013-06-27 revision 41675) [x86_64-darwin12] With Ruby in place, I could then install jekyll.\nsudo gem install jekyll Note that you can also do this after initializing the blog.\nInitialize blog Following the instructions (Fisher, 2012b) I then acquired all the setup files for Jekyll-Bootstrap. The installation instructions are quite straight forward as you will see (JB Quick Start).\nFirst, I created the lcolladotor.github.com repository on GitHub. As my GitHub username is lcolladotor, by default GitHub will consider the lcolladotor.github.com repository as a GitHub pages repository and publish it. Thus creating lcolladotor.github.io/.\nOnce the repository was created, I added the Jekyll-Bootstrap files.\n## Initialize repo with Jekyll-Bootstrap files git clone https://github.com/plusjade/jekyll-bootstrap.git lcolladotor.github.com cd lcolladotor.github.com/ git remote set-url origin [email protected]:lcolladotor/lcolladotor.github.com.git git push -u origin master Change theme to Twitter-2.0 Jekyll-Bootstrap includes several themes (JB Themes) which you check on their theme explorer. I think that J. Fisher’s blog looks good with Twitter-2.0 and decided to follow his lead. Furthermore, he has customized a few things (check his blog’s history) which I just plan on using.\n## Install Twitter-2.0 theme rake theme:install git=\u0026#34;https://github.com/gdagley/theme-twitter-2.0\u0026#34; Code highlighting The default Jekyll highlighting setup uses pygments. I am basing my statement on the documentation for the highlight argument in ?knitr::render_jekyll:\nwhich code highlighting engine to use: for pygments, the Liquid syntax is used (default approach Jekyll) So I installed Pygments.\n## Install Pygments, assuming you have Python installed curl -O http://python-distribute.org/distribute_setup.py sudo python distribute_setup.py sudo easy_install Pygments Note that (Fisher, 2012b) details some other steps. I basically copied his syntax.css file and saved it as /assets/themes/twitter-2.0/css/syntax.css\nNote that you do have to add to _includes/themes/twitter-2.0/default.html the following line:\n\u0026lt;link href=\u0026#34;/assets/themes/twitter-2.0/css/syntax.css\u0026#34; rel=\u0026#34;stylesheet\u0026#34; type=\u0026#34;text/css\u0026#34;\u0026gt; As you can see on my own file in line 23 (currently) I am using a Liquid syntax instead of specifying the full path.\nImport posts Next I had to import my posts from Tumblr. Jekyll has a varied set of tools that allow you to quickly import posts which I …","date":1383955200,"expirydate":-62135596800,"kind":"page","lang":"en","lastmod":1741387190,"objectID":"89256306ea6ea44550b0a625e67273db","permalink":"https://lcolladotor.github.io/2013/11/09/creating-your-jekyll-bootstrap-powered-blog-for-r-blogging/","publishdate":"2013-11-09T00:00:00Z","relpermalink":"/2013/11/09/creating-your-jekyll-bootstrap-powered-blog-for-r-blogging/","section":"post","summary":"As you might have noticed, I recently decided to move Fellgernon Bit from Tumblr to GitHub. There are a couple of reasons why I made this change.\nI wanted a more professional-looking blog.","tags":["Blog"],"title":"Creating your Jekyll-Bootstrap powered blog for R blogging","type":"post"},{"authors":null,"categories":["JHU Biostat"],"content":"For the past year and a half I have been a teaching assistant (TA) for the Statistical Methods in Public Health I to IV (140.621 to 140.624) courses. As part of being a TA for these courses, we have to grade between 30 and 50 homeworks every two weeks or so: four problem sets per eight week terms. For example, I now have to grade 37 homeworks:\nThese courses have been polished over time and the instructors do a great job organizing the TA group. For every problem set that we have to grade, we are given a full answer key that is later published in the course site so all the students can access it. As TAs we also receive general grading comments from the instructor; typically a two page document describing the key points that we should expect the students to be able to answer.\nAs part of the general grading comments, we are asked to give feedback beyond checkmarks such as “good job”. When the student completely misses the answer, we can simply refer them to the answer key: if they miss too many, we ask them to re-do the homework. Things get more complicated when the student misses part of the question and writing comments specific to that answer can get very time consuming. We can always use “More detailed discussion on results needed. See answer key.” but it can be nice for the student if we give them a hint on what they did wrong.\nAs a student @jhubiostat we agree to dedicate five hours per week to TA responsibilities. In the courses I have been a TA for, the responsibilities include getting familiar with the content, attending TA office hours (either general questions or STATA questions), attending the TA meetings, grading the exams, and grading the homeworks. It might sound like a lot, but I currently feel like I can it all done within the five hours per week. To do so, I obviously need to be efficient grading the homeworks.\nHere is how I do it.\nSetup Programs used:\nAdobe Acrobat Pro which I believe we can get through Hopkins for free. Alfred v2 with Powerpack purchased/installed. Why Adobe Acrobat?\nAdobe Acrobat allows you to post “stamps”. It already includes a checkmark and a red X. I also imported some simple images I made to stamp the homework as: satisfactory, unsatisfactory, or incomplete. We have to clearly mark one of these options at the top of the graded homeworks. Some of the PDF files we get are large, so I use the Save as -\u0026gt; reduced size pdf tool from Adobe Acrobat to save space and make it easier for the course administrator to upload the graded homeworks to CoursePlus (the tool the school uses for managing courses). Why Alfred v2?\nFor grading homeworks all I really need is a software that can remember my recent copy-pastes and make it easy for me to choose among them to paste them back. For example, ClipMenu can do the job. Alfred v2 has a Clipboard feature which does the above. Compared to ClipMenu it has the advantage of allowing you to search within the recent copy-pastes, making it easy to find the comment you want to paste. If you are on Windows or Linux, there must be some programs that have this functionality.\nGrading workflow Most used comment: Good job! Let me begin with a very simple case. Basically, you find a answer that is well done and you want to compliment the student for it.\nIn the homework I am currently grading, the students have to compute the 95 percent confidence interval for the difference in two proportions using the formula:\n$$ \\hat p_1 - \\hat p_2 \\pm 1.96 \\times \\sqrt{ \\frac{ \\hat p_1 (1 - \\hat p_1)}{ n_1} + \\frac{ \\hat p_2 (1 - \\hat p_2)}{ n_2} } $$\nwhich leads to (0.00142, 0.00798) with the data they are using.\nAn anonymous student (I tried to choose examples that are not identifiable) wrote an answer that has very similar numbers to those we expect. Since they included the STATA output I can recognize that they used rounded numbers (oddly only for sample 1 but not sample 2) which lead the student to slightly different values. That is not a big deal and I think it deserves the “good job!” comment. So using the “stamps”, I added a checkmark. Then I typed “Good job!” and finally, I copied it so I can paste it the next time I want to add this comment.\nThe image below shows the state at which I am copying the comment.\nMoving on, I later found another student that has the correct answer presented in a different format. If “Good job!” is the most recent comment on my clipboard, I can simply paste it. If it is not, then I can use Alfred v2 to show me my recent “copies” and select “Good job!” from the list. In this case it is under cmd + 2; you can also use the arrows and the return key, or the mouse. Although note that Alfred v2 is designed in such a way that you only have to use the keyboard to gain efficiency.\nThe end result is a green checkmark with the “Good job!” comment pasted into it. The next time I use cmd + v (the regular paste shortcut in Mac), “Good job!” will be pasted. So you only really need to invoke Alfred v2 when you want to change comments.\nDetailed …","date":1383868800,"expirydate":-62135596800,"kind":"page","lang":"en","lastmod":1741387190,"objectID":"33c71d3c726e4dde092574c9f1b3f64c","permalink":"https://lcolladotor.github.io/2013/11/08/my-strategy-for-quickly-grading-homeworks/","publishdate":"2013-11-08T00:00:00Z","relpermalink":"/2013/11/08/my-strategy-for-quickly-grading-homeworks/","section":"post","summary":"For the past year and a half I have been a teaching assistant (TA) for the Statistical Methods in Public Health I to IV (140.621 to 140.624) courses. As part of being a TA for these courses, we have to grade between 30 and 50 homeworks every two weeks or so: four problem sets per eight week terms.","tags":["Teaching"],"title":"My strategy for quickly grading homeworks","type":"post"},{"authors":null,"categories":["Web","JHU Biostat"],"content":"In recent weeks, I have met with a group of students @jhubiostat interested in blogging about their research, tutorials, pieces of R code, among plenty of other subjects. Within this group we had the idea to aggregate our blogs so it would be easier for others to follow us and to easily promote our own blogs to a much larger audience. Basically, do what R-bloggers does but focused on blogs from students at Johns Hopkins Biostatistics. Ideally, once a student publishes a new post, our site would pick it up and promote it.\nA quick search revealed that making such a site was technically possible via several WordPress plugins available. We initally tried doing so via a wordpress.com account and quickly noticed that we needed a self-hosted wordpress account.\npaper.li In the meantime, we also explored the possibility of creating a paper using paper.li which resulted in the BmoreBiostats paper. The free version allows you to select up to 25 RSS feeds (among other sources) as the source of new content that you either publish\nin the morning and afternoon, daily, weekly. This platform offers several options for promoting new content which we implemented. It can create posts to Twitter (see below), Facebook and LinkedIn.\nNew posts from students @jhubiostat http://t.co/jnHXs7qRPJ\n— bmorebiostats (@bmorebiostats) November 7, 2013 You can also embed it on a webpage just like I did in my own website.\nThe drawbacks are that customization is limited, specially if you do not like how it looks. It also does not provide you with a RSS feed. However, I did manage to get that to work via Facebook as you can notice here.\nWe have also heard some comments about paper.li been associated with spammers. I agree with this if you set the paper to be published either twice per day or daily. Weekly wise, I do not see it as a spam generator. However, this is in contradiction with the original goal of promoting posts as soon as they are made, and only when there are new posts.\nNevertheless, in my opinion, the paper.li alternative can work well as a weekly summary of the posts. Something like the Sunday data/statistics link roundoups at SimplyStatistics.\nplanetaki.com John found this resource and implemented a quick test. It looks very simple, yet it includes full length posts and was very easy to setup. Note that the material there is deleted after 7 days since they assume that you check it more than once per week. We saw this as a potential negative feature, plus there is no native support for social media.\nbmorebiostat.com Amanda and Jean-Philippe [thanks for trying out Wordpress__.com__!] figured out the WordPress solution, got us a hosted service and reserved the domain bmorebiostat.com. Then it was just a matter of choosing a plugin to do the job: we are using FeedWordPress.\nWe split the work and some tweaked the layout and added nice pictures of the six founding blog authors. Thanks to what I learnt making Fellgernon Bit I added the social features: AddThis Smart Layers, connections to social media, Disqus comments (they will not be used much), and FeedBurner RSS feeds.\nI like how the site looks and it fully achieves our initial goal. Yay!\nCurrently, BmoreBiostats is set up in a way that only the beginning of each post is shown. We can also set it up to contain full posts, but then the R code highlighting needs to be polished out.\nCurrent implementation The full current workflow is illustrated below:\nAs a group we are now thinking of dropping the paper.li route. Well, the only option we might use is the weekly one. One strong argument in favor of dropping the paper.li route is that one site avoids any dilution given by having two. Furthermore, we do not want to be seen as spammers although some shameless self-promotion is not so bad either (something I learnt from @hspter).\nI guess that I am the only one still in favor of weekly summaries and using the feature of embeding the paper in a website (like here). To minimize the dilution, all the paper.li links point to bmorebiostat.com. You can also argue that there might be some interested only on the weekly summaries. Aka, we are just giving others options!\nMaybe I am just reluctant to delete the BmoreBiostats paper so soon after I finally completed it. However, some of the work involved is not going down the drain since the social media accounts needed for the paper are now being used by bmorebiostat.com.\nNote that we do not see much of a problem with the fact that bmorebiostat.com involves monthly fees as we are hoping to get some department support (cross fingers!).\nGoing forward We are very excited that we have implemented the aggregator of student blogs from Johns Hopkins Biostatistics. We believe that it will be helpful to others including prosprective students. Now that the aggregator is practically finished, we can now move unto writing exciting posts!\nIf you are a student @jhubiostat –or a former student– and you have a Biostatistics blog that you want to add to …","date":1383782400,"expirydate":-62135596800,"kind":"page","lang":"en","lastmod":1741387190,"objectID":"72ed68415fb703d440de2b1c993212db","permalink":"https://lcolladotor.github.io/2013/11/07/bmore-biostats-is-born/","publishdate":"2013-11-07T00:00:00Z","relpermalink":"/2013/11/07/bmore-biostats-is-born/","section":"post","summary":"In recent weeks, I have met with a group of students @jhubiostat interested in blogging about their research, tutorials, pieces of R code, among plenty of other subjects. Within this group we had the idea to aggregate our blogs so it would be easier for others to follow us and to easily promote our own blogs to a much larger audience.","tags":["Blog"],"title":"Bmore Biostats is born!","type":"post"},{"authors":null,"categories":["Computing"],"content":"It is time to revive Fellgernon Bit from it’s deep hibernation period. A couple of very motivated Ph.D. students from my department (John, Alyssa, Amanda, Jean-Philippe, Elizabeth, etc) are organizing a blogging group. The idea is to review ideas, give suggestions, learn blogging technicalities, write blog posts, review them, and post them. It’s a great idea! Plus it should us keep our blogs active.\nSo for my first post I am going to talk about PosterGenius. It’s a simple to use piece of software for making posters. In my case, I presented a poster at the 7th Annual Young Investigators Symposium and Poster Session on Genomics and Bioinformatics. It was a relatively small event and I had a limited amount of time to make the poster. The idea behind PosterGenius is that you separate your poster into several sections (intro, methods, results, references), have some material for each (text and or figures), and just have to put it together with a simple background.\nOf course, there are plenty of other tools for doing this. But in my case, I was able to make a poster in lunch hour by using slides from a presentation on the same subject and just organizing the content. The basic steps are:\nChoose a poster template, number of columns, height and width. Choose how many sections and their titles. Fill in the authors, affiliations, title and institutional logos. Enter the pictures using their picture manager. You might have to choose the appropriate size of the pictures (zoom percent). For example, my slides had white space on the borders, which PosterGenius did not know, so some space was being wasted. Review it. Print it. In the following post you can find some pictures from the creation of the poster in question.\nPosterGenius has the cool feature of creating a poster, a presentation, and a handout from the same material. For other meetings, I have actually printed out a couple of handouts to give to those interested in the material.\nWhile it is not free (they have discounts for students), I think that PosterGenius is a very simple to use, produces good looking posters, and their optimal distance to read feature is quite accurate.\n","date":1383004800,"expirydate":-62135596800,"kind":"page","lang":"en","lastmod":1741387190,"objectID":"cbf6bc69234cf03fbf501357fa7bcb2c","permalink":"https://lcolladotor.github.io/2013/10/29/quickly-making-posters-with-postergenius/","publishdate":"2013-10-29T00:00:00Z","relpermalink":"/2013/10/29/quickly-making-posters-with-postergenius/","section":"post","summary":"It is time to revive Fellgernon Bit from it’s deep hibernation period. A couple of very motivated Ph.D. students from my department (John, Alyssa, Amanda, Jean-Philippe, Elizabeth, etc) are organizing a blogging group.","tags":["PosterGenius"],"title":"Quickly making posters with PosterGenius","type":"post"},{"authors":["Leonardo Collado-Torres"],"categories":null,"content":" ","date":1382219541,"expirydate":-62135596800,"kind":"page","lang":"en","lastmod":1683613619,"objectID":"98a3a267f93912627d0b94d82f232f86","permalink":"https://lcolladotor.github.io/publication/poster2013gbs/","publishdate":"2013-10-19T16:52:21-05:00","relpermalink":"/publication/poster2013gbs/","section":"publication","summary":"Poster presented at Genomics and Bioinformatics Symposium 2013, Delta Omega Poster Competition","tags":["derfinder","Poster"],"title":"Fast Annotation-Agnostic Differential Expression Analysis","type":"publication"},{"authors":["Leonardo Collado-Torres"],"categories":null,"content":"","date":1381249339,"expirydate":-62135596800,"kind":"page","lang":"en","lastmod":1621020950,"objectID":"c028e1e98dc8b402d91397f1e428c319","permalink":"https://lcolladotor.github.io/talk/ggbio2013/","publishdate":"2013-10-08T16:22:19Z","relpermalink":"/talk/ggbio2013/","section":"talk","summary":"Introduction to ggbio for the Genomics for Students club","tags":["Genomics for Students"],"title":"Introduction to ggbio","type":"talk"},{"authors":["Leonardo Collado-Torres"],"categories":null,"content":" ","date":1381163045,"expirydate":-62135596800,"kind":"page","lang":"en","lastmod":1621020950,"objectID":"36b5f059fd3ac491eadb3eb44c586a6d","permalink":"https://lcolladotor.github.io/talk/jgm2013/","publishdate":"2013-10-07T16:24:05Z","relpermalink":"/talk/jgm2013/","section":"talk","summary":"Work in progress presentation on derfinder for the Joint Genomics Meeting","tags":["Joint Genomics Meeting","derfinder"],"title":"Fast differential expression analysis annotation-agnostic across groups with biological replicates","type":"talk"},{"authors":["Leonardo Collado-Torres"],"categories":null,"content":" ","date":1380817445,"expirydate":-62135596800,"kind":"page","lang":"en","lastmod":1621020950,"objectID":"6d0ca0ee72dcf78bc98ce98b9737a8e4","permalink":"https://lcolladotor.github.io/talk/jc2013/","publishdate":"2013-10-03T16:24:05Z","relpermalink":"/talk/jc2013/","section":"talk","summary":"Introduction to high throughput sequencing and derfinder for the JHU Biostat Journal Club","tags":["Journal Club","derfinder"],"title":"Fast differential expression analysis annotation-agnostic across groups with biological replicates","type":"talk"},{"authors":null,"categories":["LIBD"],"content":"Starting this week, I’ll be doing my research with the Lieber Institute for Brain Development (LIBD) as Andrew Jaffe\u0026#39;s first Ph.D. student there. My main advisor will continue to be Jeff Leek which is great for me. I’ll have access to massive data sets at Lieber and will face the challenge of integrative genomics. That will be fun, exciting and challenging!Here’s a short video explaining what the LIBD is about and why Baltimore is a growing city.\n","date":1374019200,"expirydate":-62135596800,"kind":"page","lang":"en","lastmod":1741387190,"objectID":"87d42ff4970ec6c24abfaf3c9aff1284","permalink":"https://lcolladotor.github.io/2013/07/17/libd-video/","publishdate":"2013-07-17T00:00:00Z","relpermalink":"/2013/07/17/libd-video/","section":"post","summary":"Starting this week, I’ll be doing my research with the Lieber Institute for Brain Development (LIBD) as Andrew Jaffe's first Ph.D. student there. My main advisor will continue to be Jeff Leek which is great for me.","tags":["Research"],"title":"LIBD video","type":"post"},{"authors":["Leonardo Collado-Torres"],"categories":null,"content":" ","date":1373414400,"expirydate":-62135596800,"kind":"page","lang":"en","lastmod":1621020950,"objectID":"751d2cde96020da956425110240f3088","permalink":"https://lcolladotor.github.io/talk/user2013/","publishdate":"2013-07-10T00:00:00Z","relpermalink":"/talk/user2013/","section":"talk","summary":"Development plans for derfinder at useR!2013","tags":["derfinder"],"title":"Differential expression analysis of RNA-seq data at base-pair resolution in multiple biological replicates","type":"talk"},{"authors":null,"categories":["rstats"],"content":"ggplot TutorialI liked the following ggplot2 tutorial which is featured in Gabriela de Queiroz’s blog called unbiasedestimator. The tutorial looks very neatly presented and I’m sure that it will be very helpful to anyone just getting started with ggplot2 before they jump into ggplot2: Elegant Graphics for Data Analysis by Hadley Wickham or R Graphics Cookbook by Winston Chang.\nThe tutorial is very nicely formatted with code in bold highlighting parts that change something in the plot. Overall, the tutorial explains how to use qplot() although it does have a longer example using ggplot() to make survival curves.\nCheck it out!\nunbiasedestimator:\nGood tutorial about the R package.\n“ggplot2 is an R package for producing statistical, or data, graphics, but it is unlike most other graphics packages because it has a deep underlying grammar. [..]”\n- H.Wickham, ggplot2, Use R, DOI 10.1007/978-0-387-98141_1, © Springer Science+Business Media, LLC 2009 -\n","date":1371772800,"expirydate":-62135596800,"kind":"page","lang":"en","lastmod":1741387190,"objectID":"7c6a2177250bd1ee5f86af0f34d0e9b0","permalink":"https://lcolladotor.github.io/2013/06/21/ggplot-tutorial/","publishdate":"2013-06-21T00:00:00Z","relpermalink":"/2013/06/21/ggplot-tutorial/","section":"post","summary":"ggplot TutorialI liked the following ggplot2 tutorial which is featured in Gabriela de Queiroz’s blog called unbiasedestimator. The tutorial looks very neatly presented and I’m sure that it will be very helpful to anyone just getting started with ggplot2 before they jump into ggplot2: Elegant Graphics for Data Analysis by Hadley Wickham or R Graphics Cookbook by Winston Chang.","tags":["ggplot2","tutorial"],"title":"ggplot Tutorial","type":"post"},{"authors":null,"categories":["Ideas","UNAM","Science"],"content":"The following text is an email I sent to several of my friends from the LCG undergraduate program I studied. There I talk about keeping in touch, I invite them to ENAR 2014, and also talk about some philosophical questions regarding our future. I’m posting it here because I don’t mind sharing these thoughts and because I don’t have the current email addresses of many former LCG students.Enjoy\nHola a todos,\nLes escribo por el gusto de mantener el contacto, por razones académicas, y también por un rollo filosófico / a futuro.\nContacto\nComo ya les dije, me da mucho gusto escribirles. Cuando lo hago sé que generalmente resulta en mails largos, así que intentando ser corto, siento que hoy termina el ciclo de personas que conocí en la LCG. Digo, hoy se gradua la 7ma generación y realmente no conozco las nuevas. Fueron años muy buenos los que viví con todos allá en Cuerna y ojalá podamos mantener cierto vínculo a través de los años. Sé que cuesta. Por ejemplo, no tengo los correos de algunos (o no los encontré vía google), otros los intenté adivinar vía http://www.lcg.unam.mx/titulados y la regla de 8 caracteres, y solo pocos lo siguen teniendo en su página de Facebook (por rollos de seguridad). También soy bastante malo para escribir regularmente (ya sea vía email o mis blogs: académico \u0026amp; más personal).\nEste año en especial he disfrutado (y seguiré disfrutando) mucho de ver a algunos aunque sea un par de horas =)\nTambién me gusta mucho cuando me piden ayuda sobre algo, aunque sea lento en contestar :P\nENAR 2014\nDe lo académico, les quiero avisar que en 2014 van a organizar acá en Baltimore el congreso ENAR (Eastern North American Regional) en marzo del 2014. Es un congreso de bioestadística con una buena parte enfocada a la genómica. Y bueno, muchas cosas hechas en R. Mi jefe está organizando un par de las sesiones así que si tienen sugerencias de quienes invitar avísenme. Ustedes mismos ^_^ (hay un buen número de pláticas por alumnos de posgrado \u0026amp; postdocs), sus jefes, etc. En fin, tal vez les interese el congreso.\nDe 2014 no hay mucha info aún http://www.enar.org/meetings.cfm, pero allí pueden ver lo que pasó en otros años.\nRollos filosóficos\nEl rollo filosófico / a futuro tiene que ver con:\n¿Qué condiciones piden para trabajar en México? ¿Cómo crear un vínculo más fuerte entre egresados LCG? ¿A qué dedicarse? ¿Academia? ¿Industria? ¿Otra cosa? Del punto (1) lo he platicado con algunos pero creo que es un tema interesante y muy variado. Hay aspectos que tal vez están fuera de nuestro alcance como la seguridad, y hay otros como el ambiente de trabajo y de la ciencia. El rollo de plazas y los esfuerzos de algunos por crear espacios: CCG tiene algunas ahorita, Palacios \u0026amp; Dávila están haciendo un plan grande para repatriar ex-LCGs, el INMEGEN \u0026amp; el CINVESTAV han estado creciendo, o la idea de hacer un plan nosotros. Ojo, a penas me enteré que para tener plaza de investigador en la UNAM te piden tener un postdoc de 2 años: el chiste es que tengas publicaciones \u0026amp; hayas demostrado que la puedes hacer en la ciencia.\n¿Sacrificas potencial académico trabajando en México? Dicho de otra forma, ¿cómo te afecta: el rollo del idioma, el de competir en condiciones que parecen ser más difíciles, o el de tener menos colaboradores cerca para crecer con su crítica \u0026amp; datos de última tecnología? O irse fuera de México (no hay por que ser mártir) y sentirse a gusto con esa decisión. Siempre hay formas de colaborar.\nDel punto (2) yo opino que puede ser a través de comentar artículos con gente ex-LCG involucrada (algo así describí aquí), o tal vez vía Más Ciencia por México (no los logré convencer en esto de comentar artículos). Digo, también ayudaría que http://www.lcg.unam.mx/titulados tenga ligas a las páginas actuales de cada quien.\nDel (3), en mi opinión cubre también todo el rollo de si queremos vivir con “soft-money” a través del ciclo de donativos (el pay-line es 10% en EUA ahorita por lo de sequester), de la libertad académica (¿es una realidad o una forma de cautivarnos?), y también depende del tipo de industria. Otra forma de ver este punto es ¿cual es el nivel de estrés con el que estamos dispuestos a vivir? ¿A qué aspiramos? En fin, dan ganas de organizar alguna reunión de ex-LCGs!! Mientras, a seguir con estudios \u0026amp; disfrutar la chamba (investigación o lo que estén haciendo).\nSi me preguntan que busco con este correo, es simple:\nMantener el contacto Invitarlos a ENAR 2014 Promover discusión en estos temas filosóficos / a futuro Saludos,\nLeo\nPD Perdón, terminó siendo un mail largo :P\n","date":1370995200,"expirydate":-62135596800,"kind":"page","lang":"en","lastmod":1741387190,"objectID":"558484385354086fbeddbb44bb878007","permalink":"https://lcolladotor.github.io/2013/06/12/keeping-in-touch-enar2014-and-philosophical-questions-regarding-mexicos-future-in-genomics/","publishdate":"2013-06-12T00:00:00Z","relpermalink":"/2013/06/12/keeping-in-touch-enar2014-and-philosophical-questions-regarding-mexicos-future-in-genomics/","section":"post","summary":"The following text is an email I sent to several of my friends from the LCG undergraduate program I studied. There I talk about keeping in touch, I invite them to ENAR 2014, and also talk about some philosophical questions regarding our future. I’m posting it here because I don’t mind sharing these thoughts and because I don’t have the current email addresses of many former LCG students.Enjoy\n","tags":["Genomics","LCG"],"title":"Keeping in touch (ENAR2014?) and philosophical questions regarding México's future in genomics","type":"post"},{"authors":null,"categories":["rstats"],"content":"Description The useR2013 conference is organizing a data analysis contest, check the rules here.\nThey have a package called useR2013DAC with two data sets: one from La Liga and the other one from the Formula 1. Once you download and install the package (available here), you can quickly explore the data using the following R commands:\nData exploration ## Load the package library(useR2013DAC) ## Explore laliga data data(laliga) head(laliga) ## Season Week HomeTeam AwayTeam ## 1 2008/09 1 Athletic Club Bilbao Union Deportiva Almeria ## 2 2008/09 1 Atlético Madrid Málaga CF ## 3 2008/09 1 Betis Sevilla Real Club Recreativo Huelva ## 4 2008/09 1 CA Osasuna Villarreal CF ## 5 2008/09 1 CD Numancia FC Barcelona ## 6 2008/09 1 Deportivo de La Coruña Real Madrid CF ## HomeGoals AwayGoals ## 1 1 3 ## 2 4 0 ## 3 0 1 ## 4 1 1 ## 5 1 0 ## 6 2 1 summary(laliga) ## Season Week HomeTeam AwayTeam ## Length:1900 Min. : 1.0 Length:1900 Length:1900 ## Class :character 1st Qu.:10.0 Class :character Class :character ## Mode :character Median :19.5 Mode :character Mode :character ## Mean :19.5 ## 3rd Qu.:29.0 ## Max. :38.0 ## ## HomeGoals AwayGoals ## Min. :0.00 Min. :0.00 ## 1st Qu.:1.00 1st Qu.:0.00 ## Median :1.00 Median :1.00 ## Mean :1.65 Mean :1.14 ## 3rd Qu.:2.00 3rd Qu.:2.00 ## Max. :8.00 Max. :8.00 ## NA\u0026#39;s :50 NA\u0026#39;s :50 lapply(laliga, class) ## $Season ## [1] \u0026#34;character\u0026#34; ## ## $Week ## [1] \u0026#34;integer\u0026#34; ## ## $HomeTeam ## [1] \u0026#34;character\u0026#34; ## ## $AwayTeam ## [1] \u0026#34;character\u0026#34; ## ## $HomeGoals ## [1] \u0026#34;integer\u0026#34; ## ## $AwayGoals ## [1] \u0026#34;integer\u0026#34; ## Explore formula1 data data(formula1) head(formula1) ## Pos No Driver Team Laps Time Grid Pts ## 1 1 8 Fernando Alonso Ferrari 49 1:39:20.396 3 25 ## 2 2 7 Felipe Massa Ferrari 49 +16.0 secs 2 18 ## 3 3 2 Lewis Hamilton McLaren-Mercedes 49 +23.1 secs 4 15 ## 4 4 5 Sebastian Vettel RBR-Renault 49 +38.7 secs 1 12 ## 5 5 4 Nico Rosberg Mercedes GP 49 +40.2 secs 5 10 ## 6 6 3 Michael Schumacher Mercedes GP 49 +44.1 secs 7 8 ## Race Season ## 1 2010 FORMULA 1 GULF AIR BAHRAIN GRAND PRIX 2010 ## 2 2010 FORMULA 1 GULF AIR BAHRAIN GRAND PRIX 2010 ## 3 2010 FORMULA 1 GULF AIR BAHRAIN GRAND PRIX 2010 ## 4 2010 FORMULA 1 GULF AIR BAHRAIN GRAND PRIX 2010 ## 5 2010 FORMULA 1 GULF AIR BAHRAIN GRAND PRIX 2010 ## 6 2010 FORMULA 1 GULF AIR BAHRAIN GRAND PRIX 2010 summary(formula1) ## Pos No Driver ## Ret :254 1 : 58 Felipe Massa : 58 ## 1 : 58 10 : 58 Fernando Alonso : 58 ## 10 : 58 11 : 58 Heikki Kovalainen: 58 ## 11 : 58 12 : 58 Jenson Button : 58 ## 12 : 58 14 : 58 Kamui Kobayashi : 58 ## 13 : 58 15 : 58 Lewis Hamilton : 58 ## (Other):848 (Other):1044 (Other) :1044 ## Team Laps Time Grid ## Ferrari :116 55 :125 +1 Lap :268 1 : 58 ## Force India-Mercedes:116 56 :121 +2 Laps :102 10 : 58 ## HRT-Cosworth :116 53 : 92 Accident : 93 11 : 58 ## McLaren-Mercedes :116 57 : 80 +3 Laps : 41 12 : 58 ## STR-Ferrari :116 70 : 75 Hydraulics: 26 13 : 58 ## Lotus-Renault : 78 52 : 69 Gearbox : 24 14 : 58 ## (Other) :734 (Other):830 (Other) :838 (Other):1044 ## Pts Race Season ## :812 Length:1392 Min. :2010 ## 1 : 58 Class :character 1st Qu.:2010 ## 10 : 58 Mode :character Median :2011 ## 12 : 58 Mean :2011 ## 15 : 58 3rd Qu.:2012 ## 18 : 58 Max. :2012 ## (Other):290 lapply(formula1, class) ## $Pos ## [1] \u0026#34;factor\u0026#34; ## ## $No ## [1] \u0026#34;factor\u0026#34; ## ## $Driver ## [1] \u0026#34;factor\u0026#34; ## ## $Team ## [1] \u0026#34;factor\u0026#34; ## ## $Laps ## [1] \u0026#34;factor\u0026#34; ## ## $Time ## [1] \u0026#34;factor\u0026#34; ## ## $Grid ## [1] \u0026#34;factor\u0026#34; ## ## $Pts ## [1] \u0026#34;factor\u0026#34; ## ## $Race ## [1] \u0026#34;character\u0026#34; ## ## $Season ## [1] \u0026#34;numeric\u0026#34; I don’t see a specific question that they want you to answer with this data, but if you find one related to data analysis or visualization then join the competition!\nNote that you must be attending the conference in order to be eligible to compete.\nReproducibility ```r sessionInfo() ``` ```r ## R version 3.0.0 (2013-04-03) ## Platform: x86_64-apple-darwin10.8.0 (64-bit) ## ## locale: ## [1] en_US.UTF-8/en_US.UTF-8/en_US.UTF-8/C/en_US.UTF-8/en_US.UTF-8 ## ## attached base packages: ## [1] stats graphics grDevices utils datasets methods base ## ## other attached packages: ## [1] useR2013DAC_0.1-1 knitr_1.2 ## ## loaded via a namespace (and not attached): ## [1] digest_0.6.3 evaluate_0.4.3 formatR_0.7 stringr_0.6.2 ## [5] tools_3.0.0 ``` ","date":1370995200,"expirydate":-62135596800,"kind":"page","lang":"en","lastmod":1741387190,"objectID":"ce254b6207b6932cf40b8332b9897e2e","permalink":"https://lcolladotor.github.io/2013/06/12/userr2013-data-analysis-contest-data-exploration/","publishdate":"2013-06-12T00:00:00Z","relpermalink":"/2013/06/12/userr2013-data-analysis-contest-data-exploration/","section":"post","summary":"Description The useR2013 conference is organizing a data analysis contest, check the rules here.\nThey have a package called useR2013DAC with two data sets: one from La Liga and the other one from the Formula 1.","tags":["Graphics"],"title":"userR2013 data analysis contest: data exploration","type":"post"},{"authors":null,"categories":["Ideas"],"content":"Leader: scientific or project In my mind before trying to answer this question I have to define leader. Right now I have two —possibly conflicting— leaders in mind. One is a scientific leader in the sense of a leader in a specific scientific discipline. The other is a leader who can organize and lead projects, either scientific ones (across labs for example) or what I want to call revolutionary projects. With such a grandiose name I am trying to cover the type of projects that can help change a country. However, in reality this second type of leader is closer to administrative roles in leading academic institutions, like the chair of a department.\nGood leader So, how do we say that a leader is a good leader?\nFor the project leader (second type), I believe that the key is that a good leader gets the job done. The job might have some flaws, but this type of leader can lead a team to produce results. The next aspect you might want to request from a good leader is that they get the job done efficiently (time, resources). However, I would argue that another important characteristic is reducing (minimizing if we were to consider it a mathematical function) internal tensions (frictions).\nAs for the scientific leader, I struggle more to define it. Is a good scientific leader someone that produces good ideas and publishes them in a timely manner? Is it measured by their ability to secure research funds? Or is it that during their lifetime they had one brilliant idea that changed a field? Or is it just a measure of the number of citations?\nCommon aspects I think that one of the most important skills both types of leaders should have is the ability to write clearly. If you cannot write clearly, then you cannot communicate your ideas properly. Without communicating your ideas, you cannot convince anyone that your research work is interesting or that your project is going to succeed.\nAdditionally, I think that the ability to listen to others and synthesize their ideas is important for both types of leaders. If you cannot listen to others, you will be left alone pretty soon. But you cannot be involved in meetings all day long, so being able to quickly understand and keep the key points others are telling you (what I called synthesize) will be very helpful.\nI guess that another important trait is being able to manage some important details secretly but still being able to discuss them with others at some level where you get useful feedback. Said in a different way, you want to test if your idea sounds good but you don’t want to spill the beans and let everyone jump on it before you are ready.\nDiverging aspects Furthermore, I strongly believe that frequent communication helps reduce the internal frictions. You have to tell what is the next step in the plan, keep everyone involved, but you also have to listen to what others are telling you. While I think that frequent communication helps a lot in a lab environment or when leading a project, again I am not sure that it is something a good scientific leader has. But I know that it is something I aspire to accomplish.\nI then wonder if good oral communication skills are required for good leaders. I think that the answer is a definite yes for good scientific leaders, who after all frequently expose their work at conferences. But a project leader might not need such type of skill. Sure, they give speeches here and there but probably talk less in front of audiences.\nI am certainly separating the ability to talk one-on-one or one-to-a-small-group (like in a table) from good oral communication skills. For me the latter are related to talking in front of audiences while the former are strongly based on the person’s social skills.\nHow to become a good leader? That is really the question that I am currently asking myself.\nFor writing, I think that practicing is very important. That is one of the key reasons why I like to blog and do so in English. As for listening to others, well, I am not sure how to proceed. The secrecy aspect of things is certainly one of my weakest points.\nFrequent communication is something that I think I am decent at doing and the key for me is good email managing skills. I am obviously practicing by trying to write shorter (more concise) emails and keeping my inbox as empty as possible following most of the tips given on Inbox Zero for Life by Keith Rarick.\nBut overall, I wonder if I should take some courses beyond my scientific discipline of interest if I want to be a good leader. Writing? Maybe. I tried a Coursera course and failed to keep up during the comprehensive exam study season. Some kind of managing projects class? Hm…\nMaybe you also need to learn to be patient to be a good leader? After all, my motivation takes a big hit when I have to deal with people I would rather not. I am also not so patient with those that complain without proposing alternatives.\nWell, I guess that I am at the stage where I am seeking all the feedback I can get.\n","date":1370995200,"expirydate":-62135596800,"kind":"page","lang":"en","lastmod":1741387190,"objectID":"91d095966a3628645385e43262e4f8a3","permalink":"https://lcolladotor.github.io/2013/06/12/what-does-it-take-to-be-a-good-leader/","publishdate":"2013-06-12T00:00:00Z","relpermalink":"/2013/06/12/what-does-it-take-to-be-a-good-leader/","section":"post","summary":"Leader: scientific or project In my mind before trying to answer this question I have to define leader. Right now I have two —possibly conflicting— leaders in mind. One is a scientific leader in the sense of a leader in a specific scientific discipline.","tags":["Leader"],"title":"What does it take to be a good leader?","type":"post"},{"authors":null,"categories":["rstats"],"content":"Lets say that I want to read in this R file from GitHub into R.\nThe first thing you have to do is locate the raw file. You can do so by clicking on the Raw button in GitHub. In this case it’s https://raw.github.com/lcolladotor/ballgownR-devel/master/ballgownR/R/infoGene.R\nOne would think that using source() would work, but it doesn’t as shown below:\n```r source(\u0026#34;https://raw.github.com/lcolladotor/ballgownR-devel/master/ballgownR/R/infoGene.R\u0026#34;) ``` ```r ## Warning: unsupported URL scheme ``` ```r ## Error: cannot open the connection ``` However, thanks again to Hadley Wickham you can do so by using the devtools (Wickham \u0026amp; Chang, 2013 ) package.\nHere is how it works:\n```r library(devtools) library(roxygen2) ## Needed because this file has roxygen2 comments. Otherwise you get a ## \u0026#39;could not find function \u0026#39;digest\u0026#39;\u0026#39; error source_url(\u0026#34;https://raw.github.com/lcolladotor/ballgownR-devel/master/ballgownR/R/infoGene.R\u0026#34;) ``` ```r ## SHA-1 hash of file is 6c32a620799eded5d6ff0997a184843d7964724a ``` ```r ## Note that you can specify the SHA-1 hash to be very specific about ## which version of the file you want to read in. ``` We can then check that infoGene has actually been sourced:\n```r \u0026#34;infoGene\u0026#34; %in% ls() ``` ```r ## [1] TRUE ``` That’s it! Enjoy!\nCitations made with knitcitations (Boettiger, 2013 ).\nHadley Wickham, Winston Chang, (2013) devtools: Tools to make developing R code easier. http://CRAN.R-project.org/package=devtools Carl Boettiger, (2013) knitcitations: Citations for knitr markdown files. https://github.com/cboettig/knitcitations Reproducibility\n```r sessionInfo() ``` ```r ## R version 3.0.0 (2013-04-03) ## Platform: x86_64-apple-darwin10.8.0 (64-bit) ## ## locale: ## [1] en_US.UTF-8/en_US.UTF-8/en_US.UTF-8/C/en_US.UTF-8/en_US.UTF-8 ## ## attached base packages: ## [1] stats graphics grDevices utils datasets methods base ## ## other attached packages: ## [1] roxygen2_2.2.2 digest_0.6.3 devtools_1.2 ## [4] knitcitations_0.4-6 bibtex_0.3-5 knitr_1.2 ## ## loaded via a namespace (and not attached): ## [1] brew_1.0-6 evaluate_0.4.3 formatR_0.7 httr_0.2 ## [5] memoise_0.1 parallel_3.0.0 RCurl_1.95-4.1 stringr_0.6.2 ## [9] tools_3.0.0 whisker_0.3-2 XML_3.95-0.2 xtable_1.7-1 ``` ","date":1368057600,"expirydate":-62135596800,"kind":"page","lang":"en","lastmod":1741387190,"objectID":"2a8507150c16735913c1ab01cdf70947","permalink":"https://lcolladotor.github.io/2013/05/09/reading-an-r-file-from-github/","publishdate":"2013-05-09T00:00:00Z","relpermalink":"/2013/05/09/reading-an-r-file-from-github/","section":"post","summary":"Lets say that I want to read in this R file from GitHub into R.\nThe first thing you have to do is locate the raw file. You can do so by clicking on the Raw button in GitHub.","tags":["github"],"title":"Reading an R file from GitHub","type":"post"},{"authors":null,"categories":["rstats"],"content":"A few weeks back I dedicated a short amount of time to actually read what plyr (Wickham, 2011) is about and I was surprised. The whole idea behind plyr is very simple: expand the apply() family to do things easy. plyr has many functions whose name ends with ply which is short of apply. Then, the functions are identified by two letters before ply which are abbreviations for the input (first letter) and output (second one). For instance, ddply takes an input a data.frame and returns a data.frame while ldply takes as input a list and returns a data.frame.\nThe syntax is pretty straight forward. For example, here are the arguments for ddply:\nlibrary(plyr) args(ddply) ## function (.data, .variables, .fun = NULL, ..., .progress = \u0026#34;none\u0026#34;, ## .inform = FALSE, .drop = TRUE, .parallel = FALSE, .paropts = NULL) ## NULL What we basically have to specify are\n.data which in general is the name of the input data.frame, .variables which is a vector (note the use of the . function) of variable names. In this case, ddply is very useful for applying some function to subsets of the data as specified by these variables, .fun which is the actual function we want to run, and ... which are parameter options for the function we are running. From the ddply help page we have the following examples:\ndfx \u0026lt;- data.frame( group = c(rep(\u0026#39;A\u0026#39;, 8), rep(\u0026#39;B\u0026#39;, 15), rep(\u0026#39;C\u0026#39;, 6)), sex = sample(c(\u0026#34;M\u0026#34;, \u0026#34;F\u0026#34;), size = 29, replace = TRUE), age = runif(n = 29, min = 18, max = 54) ) # Note the use of the \u0026#39;.\u0026#39; function to allow # group and sex to be used without quoting ddply(dfx, .(group, sex), summarize, mean = round(mean(age), 2), sd = round(sd(age), 2)) ## group sex mean sd ## 1 A F 40.48 12.72 ## 2 A M 34.48 15.28 ## 3 B F 36.05 9.98 ## 4 B M 38.35 7.97 ## 5 C F 20.04 1.86 ## 6 C M 43.81 10.72 # An example using a formula for .variables ddply(baseball[1:100, ], ~year, nrow) ## year V1 ## 1 1871 7 ## 2 1872 13 ## 3 1873 13 ## 4 1874 15 ## 5 1875 17 ## 6 1876 15 ## 7 1877 17 ## 8 1878 3 # Applying two functions; nrow and ncol ddply(baseball, .(lg), c(\u0026#34;nrow\u0026#34;, \u0026#34;ncol\u0026#34;)) ## lg nrow ncol ## 1 65 22 ## 2 AA 171 22 ## 3 AL 10007 22 ## 4 FL 37 22 ## 5 NL 11378 22 ## 6 PL 32 22 ## 7 UA 9 22 But this is not the end of the story! Something I really liked about plyr is that it can be parallelized via the foreach (Analytics, 2012) package. I don’t know much about foreach, but all I learnt is that you have to use other packages such as doMC (Analytics, 2013) to actually run the code. It’s like foreach specifies the infraestructure to communicate in parallel (and split jobs) and packages like doMC tailor it for specific environments like for running in multi-core.\nRunning things in parallel can then be very easy. Basically, you load the packages, specify the number of cores, and run your ply function. Here is a short example:\n## Load packages library(plyr) library(doMC) ## Loading required package: foreach ## Loading required package: iterators ## Loading required package: parallel ## Specify the number of cores registerDoMC(4) ## Check how many cores we are using getDoParWorkers() ## [1] 4 ## Run your ply function ddply(dfx, .(group, sex), summarize, mean = round(mean(age), 2), sd = round(sd(age), 2), .parallel = TRUE) ## group sex mean sd ## 1 A F 40.48 12.72 ## 2 A M 34.48 15.28 ## 3 B F 36.05 9.98 ## 4 B M 38.35 7.97 ## 5 C F 20.04 1.86 ## 6 C M 43.81 10.72 In case that you are interested, here is a short shell script for knitting an Rmd file in the cluster and specifying the appropriate number of cores to then use plyr and doMC.\n#!/bin/bash # To run it in the current working directory #$ -cwd # To get an email after the job is done #$ -m e # To speficy that we want 4 cores #$ -pe local 4 # The name of the job #$ -N myPlyJob echo \u0026#34;**** Job starts ****\u0026#34; date # Knit your file: assuming it\u0026#39;s called FileToKnit.Rmd Rscript -e \u0026#34;library(knitr); knit2html(\u0026#39;FileToKnit.Rmd\u0026#39;)\u0026#34; echo \u0026#34;**** Job ends ****\u0026#34; date Lets say that the bash script is named script.sh. Then you can submit it to the cluster queue using\nqsub script.sh This is what I used to re-format a large data.frame in a few minutes in the cluster for the #jhsph753 class homework project.\nSo, thank you again Hadley Wickham for making awesome R packages!\nCitations made with knitcitations (Boettiger, 2013).\nRevolution Analytics, (2013) doMC: Foreach parallel adaptor for the multicore package. http://CRAN.R-project.org/package=doMC Revolution Analytics, (2012) foreach: Foreach looping construct for R. http://CRAN.R-project.org/package=foreach Carl Boettiger, knitcitations: Citations for knitr markdown files. https://github.com/cboettig/knitcitations Hadley Wickham, (2011) The Split-Apply-Combine Strategy for Data Analysis. Journal of Statistical Software 40 (1) http://www.jstatsoft.org/v40/i01/ ","date":1366934400,"expirydate":-62135596800,"kind":"page","lang":"en","lastmod":1741387190,"objectID":"481f959659f27850cd537740db347fa9","permalink":"https://lcolladotor.github.io/2013/04/26/using-plyr-and-domc-for-quick-and-easy-apply-family-functions/","publishdate":"2013-04-26T00:00:00Z","relpermalink":"/2013/04/26/using-plyr-and-domc-for-quick-and-easy-apply-family-functions/","section":"post","summary":"A few weeks back I dedicated a short amount of time to actually read what plyr (Wickham, 2011) is about and I was surprised. The whole idea behind plyr is very simple: expand the apply() family to do things easy.","tags":["plyr","parallel","knitr","cluster"],"title":"Using plyr and doMC for quick and easy apply-family functions","type":"post"},{"authors":null,"categories":["JHU Biostat","Fun"],"content":"This past Saturday the Epi and Biostat troops met for another fun kickball match. Obviously Biostat beat Epi, yup I know: again! This time the score was 15-8 (according to our bookkeeper and captain John) or 12-8 (according to some in Epi).\nThere was a hint of a surprise at the beginning when Epi scored two runs in the top of the first inning. However, the tide changed back with a homerun by Rumen. Sadly, one of the Epi players got injured and carried out of the court in that play. Rumen also pulled his quad with the big hit and was limited for the rest of the match.\nFrom that inning on forth we saw both teams having fun kicking the ball as far as we could or aim for in between the defensive lines. There were plenty of sacrifice hits, some occasional errors, but overall we had a lot of fun!\nBoth teams came prepared to show their colors: them in red us in purple with some face paint for the sport battle (thanks to Aaron). However, the Epi crew did surprise us by bringing a big grill to the park and lots of food!\nAt the end of the match, we all mingled together and enjoyed the nice (a bit chilly) day outside in the company of some drinks and food.\nSome of us then continued our journey at Kislings where we played other games that involve loads of cups and some ping pong balls ;)\nYou can view all the pictures here. If you have any other pictures that you want to share, send them my way!\n","date":1366761600,"expirydate":-62135596800,"kind":"page","lang":"en","lastmod":1741387190,"objectID":"3c3bb0cc868b23aebc293461435d6fc9","permalink":"https://lcolladotor.github.io/2013/04/24/epi-vs-biostat-kickball-match-spring-2013/","publishdate":"2013-04-24T00:00:00Z","relpermalink":"/2013/04/24/epi-vs-biostat-kickball-match-spring-2013/","section":"post","summary":"This past Saturday the Epi and Biostat troops met for another fun kickball match. Obviously Biostat beat Epi, yup I know: again! This time the score was 15-8 (according to our bookkeeper and captain John) or 12-8 (according to some in Epi).","tags":["Fun"],"title":"Epi vs Biostat Kickball match Spring 2013","type":"post"},{"authors":["Leonardo Collado-Torres"],"categories":null,"content":" ","date":1366408341,"expirydate":-62135596800,"kind":"page","lang":"en","lastmod":1683613619,"objectID":"dd1a8e049cb8ffc60b278b124a8e75dd","permalink":"https://lcolladotor.github.io/publication/poster2013retreat/","publishdate":"2013-04-19T16:52:21-05:00","relpermalink":"/publication/poster2013retreat/","section":"publication","summary":"Poster presented at JHU Biostatistics Department Retreat","tags":["derfinder","Poster"],"title":"Differential expression RNA-seq analysis with a large data set from brain samples","type":"publication"},{"authors":null,"categories":null,"content":"The goal of my Ph.D. with Jeff Leek and Andrew Jaffe at JHBSPH was to develop statistical methods and software that enable researchers to differentiate the sources of variation observed in RNA-seq while minimizing the dependance on known annotation. This allows researchers to correct for technological variation and study the biological variation driving their phenotype of interest. This work lead to the development of the derfinder and regionReport Bioconductor packages. We then applied these methods to further our understanding of neuropsychiatric disorders using the Lieber Institute for Brain Development human brains collection.\n","date":1366329600,"expirydate":-62135596800,"kind":"page","lang":"en","lastmod":1683606876,"objectID":"564e6be9d896d468092e5cc85c702ea6","permalink":"https://lcolladotor.github.io/project/derfinder/","publishdate":"2013-04-19T00:00:00Z","relpermalink":"/project/derfinder/","section":"project","summary":"Annotation-agnostic methods for gene expression data","tags":["derfinder","bulk"],"title":"derfinder","type":"project"},{"authors":["Leonardo Collado-Torres"],"categories":null,"content":"","date":1365093277,"expirydate":-62135596800,"kind":"page","lang":"en","lastmod":1621020950,"objectID":"46d9303893fcf9ffcfa2cf163f76eea2","permalink":"https://lcolladotor.github.io/talk/knitr2013/","publishdate":"2013-04-04T16:34:37Z","relpermalink":"/talk/knitr2013/","section":"talk","summary":"Introduction to knitr (R Markdown version 1) for the JHU Biostat Computing Club","tags":["Computing Club"],"title":"Introduction to knitr","type":"talk"},{"authors":null,"categories":["Fun"],"content":"“Do analytics really tell the whole story?\u0026#34; by Vic Ketchman explores how analytics is used nowadays in the NFL draft. The entry point is the \u0026#34;Moneyball\u0026#34; movie and Ketchman’s piece is mainly a digested interview to Tony Villiotti from draftmetrics.com\nAccording to him:\nWhat is analytics? It’s the accumulation of meaningful patterns in data, for the purpose of using that data to predict future results.\nI’m not a fan of the wording used, but well, the point they make is that they use data to predict the future.\nMy main issue with this article is that after the previous quote Ketchman pretty much describes some of the data. Description of the data—in my opinion—is part of what we call EDA: Exploratory Data Analysis. The data is interesting, but there are really not many predictions made.\nI’m also concerned by how some of the data is presented. For example, is the 37.1 percent rate of starts by first-round picks really different form 35.5 for the teams with losing records? Plus, it’s data from only a single year! So I think that it’s not enough to actually answer any question.\nTo end my comment, Ketchman asks:\nHow do you like those analytics?\nI don’t like them much. Sure, some of numbers presented are interesting but the ‘analytics’ are far from being great. Though I bet Villiotti has more interesting results that are only seen by the NFL teams.\n","date":1364688000,"expirydate":-62135596800,"kind":"page","lang":"en","lastmod":1741387190,"objectID":"8d320abb9aabc579a04596f25f287563","permalink":"https://lcolladotor.github.io/2013/03/31/do-analytics-really-tell-the-whole-story/","publishdate":"2013-03-31T00:00:00Z","relpermalink":"/2013/03/31/do-analytics-really-tell-the-whole-story/","section":"post","summary":"“Do analytics really tell the whole story?\" by Vic Ketchman explores how analytics is used nowadays in the NFL draft. The entry point is the \"Moneyball\" movie and Ketchman’s piece is mainly a digested interview to Tony Villiotti from draftmetrics.","tags":["NFL"],"title":"\"Do analytics really tell the whole story?\"","type":"post"},{"authors":null,"categories":["Science","Ideas"],"content":"I enjoyed reading “The importance of stupidity in scientific research\u0026#34; by Martin A. Schwartz which I learned existed through @hmason and @simplystats. I found the point of how it’s normal to feel stupid in academia and specially in Ph.D. programs to be illuminating. But Schwartz clarifies that there are other kinds of stupid:\nwe don’t do a good enough job of teaching our students how to be productively stupid – that is, if we don’t feel stupid it means we’re not really trying. I’m not talking about \u0026#39;relative stupidity’, in which the other students in the class actually read the material, think about it and ace the exam, whereas you don’t. I’m also not talking about bright people who might be working in areas that don’t match their talents. Science involves confronting our `absolute stupidity’. I don’t know about you, but I have certainly been ‘relative stupid’ at times. And yes, we have to confront our ‘absolute stupidity’. But to me, graduate school is also about learning how to be super efficient with your time. That implies being highly organized, learning how to canalize your distractions, and finding sources of constant motivation. For example, I now read more stats/R/research blogs as part of my set of distractions and have considerably decreased how many sport news I read. I also struggle with the internal challenge of doing great at school, but then also ‘having a life’. So yes, at times I have been ‘relative stupid’ but also had a great time. After all, I no longer need to ‘ace’ all my exams.\n","date":1364688000,"expirydate":-62135596800,"kind":"page","lang":"en","lastmod":1741387190,"objectID":"f22750c9b16dbd20a9b558e080d36ffd","permalink":"https://lcolladotor.github.io/2013/03/31/have-you-been-relative-stupid/","publishdate":"2013-03-31T00:00:00Z","relpermalink":"/2013/03/31/have-you-been-relative-stupid/","section":"post","summary":"I enjoyed reading “The importance of stupidity in scientific research\" by Martin A. Schwartz which I learned existed through @hmason and @simplystats. I found the point of how it’s normal to feel stupid in academia and specially in Ph.","tags":["Academia"],"title":"Have you been 'relative stupid'?","type":"post"},{"authors":null,"categories":["Science","Paper comments"],"content":"Today Jeffrey T. Leek and Steven L. Salzberg published a paper commentary in Genome Biology today titled “Sequestration: inadvertently killing biomedical research to score political points” (Leek \u0026amp; Salzberg, 2013) which I think is a must read for anyone. Seriously!\nI do not mean anyone involved in research, or all scientists. I mean, this commentary should be in the national media. Why?\nWell, let me approach the technical side first. You might think that anything that appears in a scientific journal—despite any efforts to make it accessible to the general public—will rely on words whose meaning is mostly only understood by scientists. That is not the case in this commentary: it is a dual letter meant to be read by those in Congress, but it is also an educational commentary for the general public.\nThe main reason why you should be reading this commentary is that the consequences of the ‘sequester’ are going to affect you. So if you are interested in your future and the well-being of those who you care for, then you should read it. And if you don’t know what the sequester is and how it will impact research, well, that’s another reason why you should read this commentary. Plus you might want to look at this (serious) comic from PhD comics (© Cham, 2013) to get an overall idea. Note that it was published before sequestration hit in.\nGoing back to the commentary piece by Leek and Salzberg, I can imagine someone refuting like this:\nHey, but I don’t live in the United States so it doesn’t affect me.\nThat is true in a sense because you will likely be affected by your own country’s policies more directly, and specially in policy topics that have short term impact. Nevertheless, any breakthrough made by U.S.-based research for the most part (aka, when politics doesn’t get in the way) will reach you. After all, Leek and Salzberg cite (Alivisatos et al in The Atlantic, 2013) where the following statement is made:\nNobel Prize-winning economist Robert Solow has calculated that over the past half century, more than half of the growth in our nation’s GDP has been rooted in scientific discoveries – the kinds of fundamental, mission-driven research that we do at the labs.\nThe claim that it affects other countries is just a generalization of the previous result and what I would consider some common sense. If this is not enough to attract your interest, then you should take a look at Salzberg’s previous comment “A breakthrough cure for acute leukemia?” that is a showcase example of successful biomedical research funded by the same institutions being hit by sequestration.\nI hope to have convinced you to read Leek and Salzberg’s commentary by now. So let me talk a little bit about the things that I liked the most.\nMost of all, I like the tone they used because this is not a silly matter and while it may sound as alarming as the boy who cried wolf, the reality is that the wolf does exist and will visit you. So while no visible effects have been seen from the sequester this month, that doesn’t mean that you can just ignore this problem. It is like when you throw a stone in calm water: just a few small ripples are seen at the beginning, but they reach far away. In other words, it will take some time to actually feel the negative effects.\nOverall, I consider Leek and Salzberg’s work a wake up call to politicians and you. Either you the researcher, but most importantly, you the citizen who cares about the future.\nSome, specially those who are major supporters of military programs, might disagree with the whole comparison of the F-35 plane which has an estimated cost of $400 billion to the National Institutes of Health (NIH) annual budget of around $31 billion (Leek \u0026amp; Salzberg, 2013). But to me this is just incredible!\nTo end my comments, I have to say that I am surprised that Leek and Salzberg’s commentary is behind a paywall. I thought that it would be an open-access piece. After all research articles in Genome Biology are open-access, but this is a commentary so it is not considered a research article. To their credit, Genome Biology does offer 30-day free trial subscriptions. But I am afraid that Leek and Salzberg will lose many readers due to this reason. Hopefully, you will feel motivated enough to go through the whole trial subscription process, or maybe Genome Biology will make an exception for this commentary.\n**Update: Genome Biology changed Leek \u0026amp; Salzberg’s commentary so as of March 28th it is now open-access (I wrote the post late on the 27th).\nFinally, are you not incredulous to see this situation happen? Shouldn’t the debate be about spending more money in research now that what was spent in the past? The whole sequestration topic is alarming, but the fact that the budget for research hasn’t increased in years is shocking. Oh wait, you are giving Mexico a chance to catch up to the mighty U.S. in research!!! The whole talk in Mexico about catching up with Brazil or India should be about the U.S. now! (Sadly, Mexico has a …","date":1364428800,"expirydate":-62135596800,"kind":"page","lang":"en","lastmod":1741387190,"objectID":"9d2d8d3c6048b711911a9212a1c38a54","permalink":"https://lcolladotor.github.io/2013/03/28/great-commentary-on-sequestrations-impact-on-research-national-media-should-talk-about-this-and-you-should-read-it/","publishdate":"2013-03-28T00:00:00Z","relpermalink":"/2013/03/28/great-commentary-on-sequestrations-impact-on-research-national-media-should-talk-about-this-and-you-should-read-it/","section":"post","summary":"Today Jeffrey T. Leek and Steven L. Salzberg published a paper commentary in Genome Biology today titled “Sequestration: inadvertently killing biomedical research to score political points” (Leek \u0026 Salzberg, 2013) which I think is a must read for anyone.","tags":["Paper comments","Research"],"title":"Great commentary on sequestration's impact on research! National media should talk about this and YOU should read it!!!","type":"post"},{"authors":null,"categories":["Fun"],"content":"I don’t know about you, but I think that this new “Citi ThankYou Cards” TV commercial is trying to ride the popularity train from the “HELLO KITTY IN SPACE” video.\nHm… it looks like a ripoff, smells like a ripoff, tastes like a ripoff… is it a ripoff?\nMaybe it’s just flattery, maybe it’s imitation, or maybe it’s copyright infringement. What do you think?\n","date":1364342400,"expirydate":-62135596800,"kind":"page","lang":"en","lastmod":1741387190,"objectID":"dc394e59fe67de50695f614ae8958828","permalink":"https://lcolladotor.github.io/2013/03/27/new-citi-thankyou-ballon-tv-commercial-looks-like-a-ripoff-of-hello-kitty-in-space/","publishdate":"2013-03-27T00:00:00Z","relpermalink":"/2013/03/27/new-citi-thankyou-ballon-tv-commercial-looks-like-a-ripoff-of-hello-kitty-in-space/","section":"post","summary":"I don’t know about you, but I think that this new “Citi ThankYou Cards” TV commercial is trying to ride the popularity train from the “HELLO KITTY IN SPACE” video.","tags":["TV"],"title":"New Citi ThankYou ballon TV commercial looks like a ripoff of Hello Kitty in Space","type":"post"},{"authors":null,"categories":["rstats","JHU Biostat"],"content":"It was great to have a little break, Spring break, although the weather didn’t feel like spring at all! During the early part of the break I worked on my final project for Jeff Leek’s data analysis class, which we call 140.753 here. Continuing my previous posts on the topic, this time I’ll share the results of my final project.\nAt the beginning of the course, we had to submit a project plan (more like a proposal) and in mine I announced my interest to look into some sports data. At the time I included a few links to Brian Burke’s Advanced NFL Stats site (Burke). At the time I didn’t know that Burke’s site described in detail a lot of the information I would end up using.\nMy final project had to do with splitting NFL games by half and then use only the play-by-play data from the first half to predict if team A or B would win the game. My overall goal was to have some fun with sports data which I had never looked at, but then also try to come up with something I would personally use in the future. So, why split games by half? I personally would like to know if I should keep watching a game or not at half time. Having a tool to help me decide would be great, and well, if the team I’m rooting for has high chances of losing or winning, ideally I would switch to doing something else. A related question that I didn’t try to answer is which half is worth watching? This would be a meaningful question if you only have time to watch one of them.\nTo truly satisfy my goals, it wasn’t enough to just build a predictive model. That is why I also built a web application using the shiny package (RStudio and Inc., 2013). It was the first time I did a shiny app, but thanks to the good manual and some examples on GitHub from John Muschelli like his Shiny_model it wasn’t so bad. I thus invite you to test and browse my shiny app at http://glimmer.rstudio.com/lcolladotor/NFLhalf/. It could be improved by adding some functions that scrape live data for the 2013 season so you don’t have to input all the variables needed by using the sliders. Anyhow, I’m happy with the result.\nThe entire project’s code, EDA steps, shiny app, and report are available via GitHub in my repository (lcollado753). While the details are in the report, I’ll give a brief summary here.\nBasically, I summarized the play-by-play data for all NFL games from 2002 to 2012 seasons as provided by Burke (Burke, 2010). I used some of the variables Burke uses (Burke, 2009) and some others like the score difference, who starts the second half, and the game day winning percentages of both teams. After exploring the data, I discarded the years 2002 to 2005. Then, I trained a model using the 2006 to 2011 data and did some quick model selection. Note that I’m not doing the adjustment by opponent the way Burke did it (Burke, 2009-2) in part because I was running out of time, but also because the model already uses the current game winning percentages of both teams to consider the two team’s strength. I evaluated the model using the 2012 data and after seeing that it worked decently enough, I trained a second model using the data from 2006 to 2012 so it can be used for the 2013 season. These two trained models are the ones available in the shiny app I made.\nIn the report, I didn’t include ROCs—a big miss—so here they go. The code I will show below is heavily based on a post on GLMs (denishaine, 2013). The code below is written in a way that you can easily reproduce it if you have cloned my repository for the 140.753 class (lcollado753).\nFirst, some setup steps.\n## Specify the directory where you cloned the lcollado753 repo maindir \u0026lt;- \u0026#34;whereYouClonedTheRepo\u0026#34; ## Load packages needed suppressMessages(library(ROCR)) library(ggplot2) ## Load fits. ## Remember that 1st one used data from 2006 to 2011 ## and the 2nd one used data from 2006 to 2012. load(paste0(maindir, \u0026#34;/lcollado753/final/nfl_half/EDA/model/fits.Rdata\u0026#34;)) Next, I make the ROCs for both trained models using the data that they were trained on. They should be quite good since it uses the same data to build the model that it will then try to predict.\n## Make the ROC plots ## Simple list where I\u0026#39;ll store all the results so I can compare the ROC plots later on all \u0026lt;- list() ## Construct prediction function for(i in 1:2) { ## Predict on the original data pred \u0026lt;- predict(fits[[i]]) ## Subset original data (remove NA\u0026#39;s) data \u0026lt;- fits[[i]]$data data \u0026lt;- data[complete.cases(data),] ## Construct prediction function pred.fn \u0026lt;- prediction(pred, data$win) ## Get performance info perform \u0026lt;- performance(pred.fn, \u0026#34;tpr\u0026#34;, \u0026#34;fpr\u0026#34;) ## Get ready to plot toPlot \u0026lt;- data.frame(tpr = unlist(slot(perform, \u0026#34;y.values\u0026#34;)), fpr = unlist(slot(perform, \u0026#34;x.values\u0026#34;))) all \u0026lt;- c(all, list(toPlot)) ## Make the plot res \u0026lt;- ggplot(toPlot) + geom_line(aes(x=fpr, y=tpr)) + geom_abline(intercept=0, slope=1, colour=\u0026#34;orange\u0026#34;) + ylab(\u0026#34;Sensitivity\u0026#34;) + xlab(\u0026#34;1 - Specificity\u0026#34;) + ggtitle(paste(\u0026#34;Years 2006 to\u0026#34;, c(\u0026#34;2011\u0026#34;, \u0026#34;2012\u0026#34;)[i])) print(res) ## Print the AUC value …","date":1363996800,"expirydate":-62135596800,"kind":"page","lang":"en","lastmod":1741387190,"objectID":"1bb5323a35b4ac4632fff2580e29af6b","permalink":"https://lcolladotor.github.io/2013/03/23/predicting-who-will-win-a-nfl-match-at-half-time/","publishdate":"2013-03-23T00:00:00Z","relpermalink":"/2013/03/23/predicting-who-will-win-a-nfl-match-at-half-time/","section":"post","summary":"It was great to have a little break, Spring break, although the weather didn’t feel like spring at all! During the early part of the break I worked on my final project for Jeff Leek’s data analysis class, which we call 140.","tags":["NFL","Prediction"],"title":"Predicting who will win a NFL match at half time","type":"post"},{"authors":null,"categories":["Misc"],"content":"I do not have a clear memory of when I started to write or in which language it was. My first written words might have been in English since I lived in Boston (USA) three years during my early childhood. By age five I was back in Mexico and that is where I am sure I wrote my first full homeworks. During elementary school, I changed languages once more—this time to French. By middle school, I started to be interested in two new types of languages. One was mathematics which I liked, but which I didn’t consider till much later. The other was related to computers as I learnt the very basics of HTML—that’s all I know so far. In college—having reverted back to Spanish and English—and in my current stage in graduate school, I am a writer because I write—I mainly typeset using LaTeX—my homeworks, code in R, and summarize findings in reports. For the past year, I have been using Fellgernon Bit to practice writing and hopefully improve my skills. Furthermore, for me the process of writing helps me clarify my thoughts and organize them before attempting to communicate them. Sometimes it works, others it doesn’t. Finally, I am a writer because it is crucial in the academic environment to be able to communicate through the printed word. This is tricky because sometimes you want to be very short, direct but not leave anything important out, like when emailing a professor. Other times, you have to be very precise and clear yet tell an interesting story such as when writing a scientific report.\nOverall, I consider myself a writer in training and would like to improve. But as with everything, practice is key. That’s a big part of why I blog and why I’m enrolled in this course.\n","date":1363824000,"expirydate":-62135596800,"kind":"page","lang":"en","lastmod":1741387190,"objectID":"aec8a9b6cf5415745fc3ef1dac5f9ce2","permalink":"https://lcolladotor.github.io/2013/03/21/i-am-a-writer-exercise/","publishdate":"2013-03-21T00:00:00Z","relpermalink":"/2013/03/21/i-am-a-writer-exercise/","section":"post","summary":"I do not have a clear memory of when I started to write or in which language it was. My first written words might have been in English since I lived in Boston (USA) three years during my early childhood.","tags":["Coursera"],"title":"\"I am a writer\" exercise","type":"post"},{"authors":null,"categories":["rstats","Misc"],"content":"This week started the English Composition I: Achieving Expertise course (Comer, 2013) that I have been looking forward to.\nI am not sure yet how long I will last, but I hope to enjoy it as much as I can. Plus, it should help me with my posting and other writing areas. While I last in the course, I plan to publish my writings in the blog too. So you will hopefully see me be more active here.\nAs it is important to cite when writing, I have also figured out how to do so automatically in Rmd files. For that I learnt how to use knitcitations from the GitHub instructions (knitcitations) and a explanatory post (Boettiger, 2013).\nknitcitations is great, but it kind of struggles with some pages. That is why I modified my template in FBit by writing my own citing function for pages where citep fails. Here is the code:\n## I made my own citing function since citep() doesn\u0026#39;t work like I want to with ## urls that are not really pages themselve like part of a GitHub repo. mycitep \u0026lt;- function(x, short, year=substr(date(), 21, 24), tooltip=TRUE) { tmp \u0026lt;- citep(x) res \u0026lt;- gsub(\u0026#34;\u0026gt;\u0026lt;/a\u0026gt;\u0026#34;, paste0(\u0026#34;\u0026gt;\u0026#34;, short, \u0026#34;\u0026lt;/a\u0026gt;\u0026#34;), tmp) if(tooltip) { res \u0026lt;- gsub(\u0026#34;\\\\?\\\\?\\\\?\\\\?\u0026#34;, year, res) } res } ## You already saw an inline working example in the post itself. Carl Boettiger, (2013) knitcitations. Lab Notebook http://www.carlboettiger.info/2012/05/30/knitcitations.html cboettig, knitcitations. GitHub https://github.com/cboettig/knitcitations Coursera. Coursera https://www.coursera.org/course/composition ","date":1363824000,"expirydate":-62135596800,"kind":"page","lang":"en","lastmod":1741387190,"objectID":"ff33ba5fba9edfb4506c7f9dce8fc500","permalink":"https://lcolladotor.github.io/2013/03/21/and-so-begins-english-composition-i/","publishdate":"2013-03-21T00:00:00Z","relpermalink":"/2013/03/21/and-so-begins-english-composition-i/","section":"post","summary":"This week started the English Composition I: Achieving Expertise course (Comer, 2013) that I have been looking forward to.\nI am not sure yet how long I will last, but I hope to enjoy it as much as I can.","tags":["Coursera"],"title":"And so begins English Composition I","type":"post"},{"authors":null,"categories":["Paper comments","Ideas","UNAM"],"content":"I’ve been thinking about commenting papers in blog posts. I did a few some long time ago, but now I’m thinking of doing this activity more systematically. There are several reasons why I’m thinking of doing this, say for 1 paper a week. It has the obvious advantage of forcing me to read a paper in depth per week. At the same time, I want to learn more from others. See what I like in other papers and maybe avoid some mistakes. There are two main lines of papers that I would be posting about. Anything that is somewhat close to my research (genomics, RNA-seq, biostatistics, bioconductor, visualization) and anything done by my undergrad peers from LCG-UNAM. I don’t think that there is a compilation of papers from LCG students despite many of us doing research all over the globe —Mexico, US, Canada, Denmark, France, England, Germany, Switzerland, Austria, Australia to name a few countries. Maybe compiling a list of papers with contributions from LCG students is a task for Más Ciencia por México which seeks to promote science in Mexico. But I would be happy to learn what others are doing and in a way keep in touch academically. Another reason in favor is that blogging helps me practice my English. And writing helps me organize my ideas.\nBut, the question remains, if you systematically comment papers, what would you comment on?\nI think that I should state my opinion of the paper in different areas. Kind of like doing a review. First, try to summarize the paper. Next, was the scientific objective clear? They did answer the main question? Then, given the nature of my Ph.D. program, I think that I should try to comment on any statistics used in the papers. This certainly includes the plots and reproducibility. If they included tools (software), I could take a quick look at it. Then, I can end with stating the main things I liked. Maybe I could come up with some scoring mechanism to rate the paper.\nYou can think of other aspects to talk about of a paper. For example, in what way did it help it’s field? But, I don’t think that I can answer this for many papers outside my research area. It would all be speculation. I guess that I could use Google Scholar to see who cited the paper and maybe comment on it’s impact that way. For the LCG papers, I could point out how the LCG students contributed. Or maybe I could take the more educational route. But that’s very time consuming as I can see from La Ciencia explicada\u0026#39;s highly detailed posts.\nAnyhow, if I have something clear in mind is how I would implement it. I’m thinking of making a GitHub repository and writing my comments using Rmd and knitr. Then posting them here using Markdown. It should be easy to then have a template post and fill in the gaps after reading the paper.\nThe risk of using a template is that the comments will start to look boring. That’s why I might add a more free section, or change things up a bit.\nIf you have any ideas, let me know!\n","date":1362960000,"expirydate":-62135596800,"kind":"page","lang":"en","lastmod":1741387190,"objectID":"b184ea0ac9dc1bf0432a4e6706ebeda9","permalink":"https://lcolladotor.github.io/2013/03/11/commenting-scientific-papers/","publishdate":"2013-03-11T00:00:00Z","relpermalink":"/2013/03/11/commenting-scientific-papers/","section":"post","summary":"I’ve been thinking about commenting papers in blog posts. I did a few some long time ago, but now I’m thinking of doing this activity more systematically. There are several reasons why I’m thinking of doing this, say for 1 paper a week.","tags":["Paper comments","LCG"],"title":"Commenting scientific papers","type":"post"},{"authors":null,"categories":["JHU Biostat","rstats"],"content":"Recently we had to analyze the data of the number of visits per day to SimplyStatistics.org. There were two goals:\nEstimate the fraction of visitors retained after a spike in the number of visitors Identify (if any) any factors that influence the fraction estimated in 1. For me it was a fun project in part because I like SimplyStatistics but also because I think that finding the answers to the questions would be interesting and help understand the readers of that blog.\nSadly, I didn’t work on it much. We had lots of stuff due that week, but well, I’m happy enough with the analysis I did. My own report is hosted here and this is the pdf file of the report itself.\nHalf joking with other students, I said that I basically did t-tests. Hopefully I can work on changing this tendency with the pile of recommended books I’ve been acquiring but not really reading through. Except for the ggplot2: Elegant Graphics for Data Analysis and the R Graphics Cookbook. Sounds like spring break will be fun :P\nKind of related to this, Jeff Leek announced yesterday that he is going to compile a list of student blogs that have something to do with statistics and data. He added a link to my blog which is why I saw a large peak of Fellgernon Bit’s visitor data. After all, when doing the data analysis described above I played around with the data from Fellgernon Bit and now know that at a minimum posting drives visitor’s into sites (which sounds obvious, but maybe you get random traffic) —see fig 1 of the report.\nHad Jeff done so before, I could have a point estimate (but without being able to say something about the uncertainty of it) that SimplyStatistics has 142 visitors that read the posts AND click on the links. Maybe using the info from Hilary’s and Alyssa’s blogs we could have an estimate with some measure of uncertainty, but only for March 8th.\n","date":1362787200,"expirydate":-62135596800,"kind":"page","lang":"en","lastmod":1741387190,"objectID":"a6c623ec1a6088c13ad41d3a7965d2dd","permalink":"https://lcolladotor.github.io/2013/03/09/analyzing-simplystatistics-visits-info/","publishdate":"2013-03-09T00:00:00Z","relpermalink":"/2013/03/09/analyzing-simplystatistics-visits-info/","section":"post","summary":"Recently we had to analyze the data of the number of visits per day to SimplyStatistics.org. There were two goals:\nEstimate the fraction of visitors retained after a spike in the number of visitors Identify (if any) any factors that influence the fraction estimated in 1.","tags":["Blog"],"title":"Analyzing SimplyStatistics visits info","type":"post"},{"authors":["Leonardo Collado-Torres"],"categories":null,"content":" ","date":1362587045,"expirydate":-62135596800,"kind":"page","lang":"en","lastmod":1621020950,"objectID":"7dfd872d57682f3f741c5ae572273ff0","permalink":"https://lcolladotor.github.io/talk/htsintro2013/","publishdate":"2013-03-06T16:24:05Z","relpermalink":"/talk/htsintro2013/","section":"talk","summary":"Introduction to high throughput sequencing and RNA-seq for the Genomics for Students club","tags":["Genomics for Students"],"title":"Introduction to High-Throughput Sequencing and RNA-seq","type":"talk"},{"authors":null,"categories":["Computing"],"content":"At the beginning of the semester, I decided to go hunting for Mac apps that would help me be more organizing and/or enjoy my Mac even more. After all, I was using the basics –with multiple spaces– and had only customized my favorite editors. It turns out that Alfred is an excellent app. The free version can get you a lot of mileage and save you lots of time by typing alt + space, then entering the keyword you want to search in Google. Or alt + space, image, then the query for Google Images. Or alt + space, find, the parts of the name of a file you want. Or alt + space, in, something you want to find inside a file. I love the alt + space, define, something I want to find in the dictionary. I know that dictionaries are just around the corner [a bookmark away!] but still, thanks to Alfred I now look up words WAY more frequently than what I did before. I mean, just not having to move my hands away from my keyboard and doing a ton of stuff is just great =)\nThere are plenty of other default searches that come with Alfred’s free version. Another thing that I love is using it to do system commands like lock the screen, or send my computer to sleep.\nTry it out!\n","date":1360886400,"expirydate":-62135596800,"kind":"page","lang":"en","lastmod":1741387190,"objectID":"a43eab565448a584bd979e7aa88ace67","permalink":"https://lcolladotor.github.io/2013/02/15/alfred-a-must-for-any-mac-user/","publishdate":"2013-02-15T00:00:00Z","relpermalink":"/2013/02/15/alfred-a-must-for-any-mac-user/","section":"post","summary":"At the beginning of the semester, I decided to go hunting for Mac apps that would help me be more organizing and/or enjoy my Mac even more. After all, I was using the basics –with multiple spaces– and had only customized my favorite editors.","tags":["Mac"],"title":"Alfred: a must for any Mac user","type":"post"},{"authors":null,"categories":["JHU Biostat"],"content":" ","date":1360886400,"expirydate":-62135596800,"kind":"page","lang":"en","lastmod":1741387190,"objectID":"93e1b3ac2ae4fa87e0faf2095713506b","permalink":"https://lcolladotor.github.io/2013/02/15/second-cultural-mixer-today/","publishdate":"2013-02-15T00:00:00Z","relpermalink":"/2013/02/15/second-cultural-mixer-today/","section":"post","summary":" ","tags":["Fun"],"title":"Second cultural mixer today!","type":"post"},{"authors":null,"categories":["Web"],"content":"I’ve been using the “Inbox Zero for Life\u0026#34; strategy for a few weeks, and I think that it’s been payed off for me in this short span.\nAs it’s stated in that long guide, one of the major concerns you might have is that it could end up as just changing a current problem for another one. I think that so far, that hasn’t been the case for me. Sure, my starred emails is not 0, but it stays at a steady number and doesn’t increase as my inbox (even with priority inbox) did. I also have a few filters in place that pick up the emails that I will most likely never read. For example, advertising emails and school wide announcements.\nOne point I’m not sure that I buy is the whole psychological effect of having an empty inbox. But whether or not that’s true, I certainly didn’t know that the gmail app in the iPhone/iPad has a weird smiley that looks like a sun telling you something like: “Your inbox is empty. Have a nice day!”\nCredit goes to Hilary for finding telling us about this strategy.\n","date":1360800000,"expirydate":-62135596800,"kind":"page","lang":"en","lastmod":1741387190,"objectID":"1c92407e598d0dbbbd3f3ddc15468efe","permalink":"https://lcolladotor.github.io/2013/02/14/liking-inbox-zero-for-life/","publishdate":"2013-02-14T00:00:00Z","relpermalink":"/2013/02/14/liking-inbox-zero-for-life/","section":"post","summary":"I’ve been using the “Inbox Zero for Life\" strategy for a few weeks, and I think that it’s been payed off for me in this short span.\nAs it’s stated in that long guide, one of the major concerns you might have is that it could end up as just changing a current problem for another one.","tags":["Gmail"],"title":"Liking \"Inbox Zero for Life\"","type":"post"},{"authors":null,"categories":["JHU Biostat","rstats"],"content":"This semester I’m taking the live version of the Data Analysis class by Jeff Leek. His more popular version of the course is available through Coursera. One of the things that Jeff promotes is reproducibility and sharing code. I share that tendency and thus created a Git repository for my homework and code for the class: lcollado753. I’m hosting it with GitHub to try it out since I started with Mercurial via Bitbucket. Part of me would love it if everyone in the class had their own Git repositories. I mean, this class involves lots of practice exercises and there are plenty of R packages and functions that others use that I would like to learn. As I don’t see this happening, I think that it would be great to list the packages/functions you think could be interesting to others at the end of the write-ups. However, this involves sharing the reports and I don’t know if that will happen.\nBut maybe I didn’t get the instructions Jeff gave correctly the first time. Listening into his week 2 talks from the Coursera course, I get that he wants our reports to be reproducible. The idea is great, but sometimes I get lots in the technicalities of finding the best fit for our situation. Aka, something we can all do that is worth the time for small scale projects that we have a couple of days to complete and most likely will be finishing the day before they are due. For now we might stick to sharing zip files with the report + summarized data set (it has be small enough to be sharable by email).\nI’m pretty happy with hosting my stuff at GitHub. One blunder I made in the first data analysis report is that I completely forgot to say in it that I have the code in GitHub :P Oh well, next time!\nI feel that I also have lots to improve regarding how to tell a story in a report. Plus, for this first project I mainly did some exploratory data analysis without much stat analysis.\nOverall, I’m quite excited with this course =) and I think that I’ll learn a ton on methods to analyze data AND how to actually implement them. Plus, I’m currently trying to learn ggplot2 as you can see in that first report. Also, I made it with knitr instead of Sweave =)\n","date":1360713600,"expirydate":-62135596800,"kind":"page","lang":"en","lastmod":1741387190,"objectID":"b306199861cd3fda11e0926702894c40","permalink":"https://lcolladotor.github.io/2013/02/13/sharing-my-work-for-advanced-methods-iii/","publishdate":"2013-02-13T00:00:00Z","relpermalink":"/2013/02/13/sharing-my-work-for-advanced-methods-iii/","section":"post","summary":"This semester I’m taking the live version of the Data Analysis class by Jeff Leek. His more popular version of the course is available through Coursera. One of the things that Jeff promotes is reproducibility and sharing code.","tags":["Git","Biostatistics"],"title":"Sharing my work for \"Advanced Methods III\"","type":"post"},{"authors":["Leonardo Collado-Torres"],"categories":null,"content":" ","date":1355156870,"expirydate":-62135596800,"kind":"page","lang":"en","lastmod":1621020950,"objectID":"b0e7fc3357008f2ee85bb8540bf2ad1d","permalink":"https://lcolladotor.github.io/talk/dexseq2012/","publishdate":"2012-12-10T16:27:50Z","relpermalink":"/talk/dexseq2012/","section":"talk","summary":"Discussion on the DEXSeq paper for the Genomics for Students club","tags":["Genomics for Students"],"title":"DEXSeq paper discussion","type":"talk"},{"authors":null,"categories":["Web"],"content":"I got a question today on how to add a video to a beamer pdf presentation. Well, I had never done it, but I got curious enough to google around for a bit and here is the end product.\nOne way of doing it is using the media9 tex package. For this to work you need to have the latest version of texlive (or miktex). Then, it’s quite straight forward to include the video. The issue is that you have to open the pdf with Acrobat Reader 10+ (9 something works. I think that it’s 9.4.1+ but well, the point is that you need an updated version). You will also need a live web connection to actually show the video. An alternative (if you have the video file) is to convert it to swf and embed it. Here is my tex example file with the corresponding pdf output compiled using pdflatex. Remember that you need Acrobat Reader to actually see the video in the pdf.\nAfter doing this, I just wanted to make some quick examples on how you can add a video to an html report using markdown (well, you add the video itself using html). I did it via knitr and Rstudio.\nExample Rmd file with corresponding md and html * outputs from “knit HTML” in Rstudio.\nFinally, the more interesting thing you can do is an html presentation which requires pandoc. Again, I used knitr to get things started and, while at it, add some R and math.\nExample Rmd file with corresponding md and html * output from “knit HTML” in Rstudio. The slides are created from the md file using pandoc into this html ** file (main output in this case). Hopefully they’ll be useful to anyone venturing into embedding youtube videos in their presentations.\n* These two files are very similar.\n** html presentation.\n","date":1354665600,"expirydate":-62135596800,"kind":"page","lang":"en","lastmod":1741387190,"objectID":"0d590791b9baa32356f94af8469ba23d","permalink":"https://lcolladotor.github.io/2012/12/05/adding-youtube-videos-in-pdfs-html-reports-and-html-presentations/","publishdate":"2012-12-05T00:00:00Z","relpermalink":"/2012/12/05/adding-youtube-videos-in-pdfs-html-reports-and-html-presentations/","section":"post","summary":"I got a question today on how to add a video to a beamer pdf presentation. Well, I had never done it, but I got curious enough to google around for a bit and here is the end product.","tags":["knitr","pdf","html"],"title":"Adding youtube videos in pdfs, html reports and html presentations","type":"post"},{"authors":["Leonardo Collado-Torres"],"categories":null,"content":"Blog post describing this talk\n","date":1352737758,"expirydate":-62135596800,"kind":"page","lang":"en","lastmod":1621020950,"objectID":"d2bd44e26aa6458339e64e27972ad9aa","permalink":"https://lcolladotor.github.io/talk/introbiostats2012/","publishdate":"2012-11-12T16:29:18Z","relpermalink":"/talk/introbiostats2012/","section":"talk","summary":"Introduction to Biostatistics for LCG-UNAM students (2012 version)","tags":["LCG"],"title":"Introduction to R and Biostatistics (2012 version)","type":"talk"},{"authors":null,"categories":["UNAM","rstats"],"content":"To follow my Introducing R and Biostatistics to first year LCG students (2012 version) post, you can now find the presentation online from my site either in presentation format, in a single webpage format, or the raw Rmd file. To prove the point that publishing to RPubs is super easy, you can also find the single webpage format over there. I also like how you can comment and share in RPubs.\nOne of the challenges of giving a presentation to first year students is finding the balance between introducing them to cool things you are doing in your work and actually giving a talk that they can follow. I thought about this and ended dropping anything related to my work.\nMy presentation was split pretty much in two parts. First, I wanted to promote some philosophical discussion about what is statistics. Second, I gave a brief overview of what you can do with R. Or more exactly, what they should be able to learn to do even if they become wet biologists.\nWhile planning this presentation, I knew that I wanted to give the new students a flavor of the three different currents in statistics. I aimed to improve my 2011 explanations now that I’m taking the Foundations of Statistical Inference course. I’m happy with the result and I think this is greatly due to Royall’s diagnostic test example.\nAnother key point that I wanted to emphasize was that RStudio is the way to go if you are new to R. It is very straightforward to use, plus it is nicely interegrated with knitr.\nI decided to use R Markdown (Rmd) for the first time, after seeing how easy Markdown really is compared to using LaTeX and Beamer. However, when it got to doing the presentation I have to say that I was a bit dissapointed by how some things just break when using the R Markdown to Markdown to HTML presentation pipeline —using pandoc for the last step. For example, the math breaks when using mathml or mathjax at times (like after adding an iframe for a youtube video), so I had to use webtex which doesn’t look as nice.\nIf you are interested in the commands, I used the “Knit HTML” button in R Studio [equivalent to running from R: library(knitr); knit(“filename.Rmd”)] and then ran the following command:\npandoc -s -S —webtex -i -t dzslides intro_R_Biostat_LCG_2012.md -o intro_R_Biostat_LCG_2012_slides.html \u0026amp; open intro_R_Biostat_LCG_2012_slides.html\nI was originally aiming to have a single Rmd file to produce an HTML presentation and a Beamer presentation. However, controlling the pictures in the Beamer output proved to be challenging. While I had a work around, the final problem was the math part. By the time I realized this it was too late —I just dropped the Beamer presentation. Googling, even the author of knitr acknowledges that the best input for PDF output is still LaTeX.\nIn the end, I’m happy that I got the HTML presentation done using R Markdown and briefly introduced it to the first year students. The basics of knitr are very easy to learn and I’m hoping that it got some of them curious enough to try it.\nNext thing in line: prepare 5 questions for the students.\n","date":1352678400,"expirydate":-62135596800,"kind":"page","lang":"en","lastmod":1741387190,"objectID":"3ad13a132747d518400a1acdb1664e41","permalink":"https://lcolladotor.github.io/2012/11/12/introduction-to-r-and-biostatistics-2012-version-presentation/","publishdate":"2012-11-12T00:00:00Z","relpermalink":"/2012/11/12/introduction-to-r-and-biostatistics-2012-version-presentation/","section":"post","summary":"To follow my Introducing R and Biostatistics to first year LCG students (2012 version) post, you can now find the presentation online from my site either in presentation format, in a single webpage format, or the raw Rmd file.","tags":["LCG","knitr","Biostatistics"],"title":"Introduction to R and Biostatistics (2012 version): presentation","type":"post"},{"authors":null,"categories":["Computing"],"content":"When Sandy was in town at some point I started doing some of my research work, but I shouldn’t have. I basically did a silly mistake and erased files that take a long time to compute.\nPrior to being here, I had an alias in my bash profile like this:\nalias rm=’rm -i’\nBut when I setup my bash profile here I googled a bit to find what was the best common solution to avoid deleting stuff you shouldn’t be deleting. That’s when I found the following stackoverflow entry: `alias rm=“rm -i”` considered harmful?\nOne of the answers suggests using rmi instead of rm for the alias. The idea is that you will never expect that rm will run interactively in other machines, which could potentially be disastrous. Being “smart”, I set up my alias to be rmi. However, I started using rm (without expecting it to be interactive) and just ignored the alias.\nProblem is that I ran a more command with a pattern, saw that the files were empty, then deleted them with rm. Next, I wanted to check a different pattern, used the up arrow key and instead of editing the more command, I edited the rm command. When I noticed it, it was too late.\nLuckily, I only deleted some output files that I can recover. But it was a pretty basic mistake. And yes, the files were not backed up.\nAnyhow, I will now stick to my rmi alias and hopefully avoid running into this kind of pitfall ever again.\n","date":1352246400,"expirydate":-62135596800,"kind":"page","lang":"en","lastmod":1741387190,"objectID":"ebfd1a64db79a3743f6af39a7d7080ce","permalink":"https://lcolladotor.github.io/2012/11/07/me-bad-rm-dont-delete-stuff-i-didnt-want-to-delete-rm-well-i-do-what-you-tell-me-to-do/","publishdate":"2012-11-07T00:00:00Z","relpermalink":"/2012/11/07/me-bad-rm-dont-delete-stuff-i-didnt-want-to-delete-rm-well-i-do-what-you-tell-me-to-do/","section":"post","summary":"When Sandy was in town at some point I started doing some of my research work, but I shouldn’t have. I basically did a silly mistake and erased files that take a long time to compute.","tags":["UNIX","Computing"],"title":"me: Bad rm, don't delete stuff I didn't want to delete! (rm: well, I do what you tell me to do!)","type":"post"},{"authors":null,"categories":["Science"],"content":"During the weekend while I was talking with a friend and former colleague, I realized that my name was mentioned in the acknowledgments section of a paper :) I haven’t been much in touch with what’s been happening back home, so this was a nice surprise.\nThe paper is: Genetic changes during a laboratory adaptive evolution process that allowed fast growth in glucose to an Escherichia coli strain lacking the major glucose transport system by Aguilar et al. It was published in BMC Genomics in 2012.\n","date":1351641600,"expirydate":-62135596800,"kind":"page","lang":"en","lastmod":1741387190,"objectID":"38f392c4dd88c21169c72e02065c65a4","permalink":"https://lcolladotor.github.io/2012/10/31/got-acknowledged-in-a-paper/","publishdate":"2012-10-31T00:00:00Z","relpermalink":"/2012/10/31/got-acknowledged-in-a-paper/","section":"post","summary":"During the weekend while I was talking with a friend and former colleague, I realized that my name was mentioned in the acknowledgments section of a paper :) I haven’t been much in touch with what’s been happening back home, so this was a nice surprise.","tags":["Research"],"title":"Got acknowledged in a paper ^^","type":"post"},{"authors":null,"categories":["UNAM","rstats"],"content":"On Friday November 9th I’ll be giving a talk to the first year students from the Undergraduate Program on Genomic Sciences (LCG in Spanish) during their “Seminar 1: Introduction to Bioinformatics” course. It’s just like I did a year ago as I documented in my post Introducing Biostatistics to first year LCG students.\nWell, this time I’ll change things a bit. I’m allowed to require the students to read 2-3 papers before my talk to introduce them to my field. I’ll do so, but in a more peculiar way by requiring them to listen in to a few videos I selected. So, without further ado here are the three required “papers”:\nHere is “paper 1\u0026#34; (~30 minutes). The goal is to introduce you to the basic workings of R and also to great sources of R videos.\nFirst, learn to install R (watch it in full screen).\nOr you can also watch any of the two following videos:\nNext learn about RStudio and why it’s a great place to start (watch it on hd and fullscreen).\nNow you are ready to learn how to create a variable in R. Use RStudio instead of the R GUI to do so.\nNext, learn the super basics about the basic R plot system.\nNow you are ready to learn about how to use the combine function.\nNext, learn about data.frame type of objects\nand how to add new variables to them.\nNext up is learning how to find help.\nAlmost there. Now check how to change your current working directory.\nFinally, learn how to install and load a package in R.\nIf you are more curious regarding the origins of R check the next video (not part of “paper 1”).\nNext, “paper 2\u0026#34; (~39 minutes). The goal here is to get a feeling of how you can use R to create plots.\nFirst start with this demonstration of the basic R plotting tools (called “base graphics”). It does in enough level of detail of how the basic plotting system works and how you can customize the colors, layout, etc. For the purpose of getting used to the tool, I recommend that you follow this video using RStudio. Also, you’ll want to watch it in 720p.\nNow check the demo for plotting with the lattice package. This is more advanced, but it should also be more illustrative of the power you have with R. Plus it shows how we can expand the functionality of R by using packages contributed to the community and freely available for us to use.\nFinally, “paper 3\u0026#34; (~28 minutes). This is the first lecture from a course by Brian Caffo in which he goes over the definition and overall motivation behind Biostatistics. It should be much more fun to watch than reading a review paper in the area.\nNow, for those motivated to learn more, I recommend some of my own posts summarizing information that can be useful to you.\nJHSPH-Biostat through Coursera and An Online Bioinformatics Curriculum Setting up your computer for bioinformatics/biostatistics and a compedium of resources Motivation behind using a version control system and Introducing Git while making your academic webpage Why aren’t all of our graphs interactive? and Visualizing colors() P-values and Statistics phylosophy The new visualization package for genome data in Bioconductor: ggbio Sources:\nhttp://www.twotorials.com/ by Anthony Damico Youtube videos by Roger Peng Youtube videos by Brian Caffo ","date":1351555200,"expirydate":-62135596800,"kind":"page","lang":"en","lastmod":1741387190,"objectID":"6641b22fadd2799384af998cde582174","permalink":"https://lcolladotor.github.io/2012/10/30/introducing-r-and-biostatistics-to-first-year-lcg-students-2012-version/","publishdate":"2012-10-30T00:00:00Z","relpermalink":"/2012/10/30/introducing-r-and-biostatistics-to-first-year-lcg-students-2012-version/","section":"post","summary":"On Friday November 9th I’ll be giving a talk to the first year students from the Undergraduate Program on Genomic Sciences (LCG in Spanish) during their “Seminar 1: Introduction to Bioinformatics” course.","tags":["Biostatistics","LCG"],"title":"Introducing R and Biostatistics to first year LCG students (2012 version)","type":"post"},{"authors":null,"categories":["Web"],"content":"Amanda and I are organizing a cultural student mixer for students in our department. One of the things we needed to do was invite everyone to attend. I like using computers, but graphic design is not something that I’m too excited about, but I still wanted to try something out.\nMy goal was to show an image of a bowling lane where the Earth (as the ball) knocks down “statistical pins”. We recently covered least squares in our class, so I felt that the analogy of “minimizing our cultural differences” fit perfectly. I’ve used Photoshop in the past, but after reading (or parts of) Photoshop, Illustrator, or Indesign? by Chris Takakura I decided to use Illustrator. The first thing I tried to do was to crop the Earth from the following image which I found using Google Images with the “large” option (I didn’t want small pics that would look bad if enlarged).\nSource\nBut it turns out that you don’t “crop” in Illustrator. You use “clipping masks” as explained here. It took me some time to figure this out, but it was easy once I used the “ellipse tool”. I was expecting a visual shape, but I got a circular “path”.\nNext, I found a good bowling lane image:\nSource\nWith this, it was easy to “place” the image (I found the term from this tutorial). After resizing everything and moving the Earth image to the front (arranging it), I followed this tutorial to place text on a path. This was quite easy. Finally, I just wanted to add a green checkmark for the drinks + snacks + beers message. That was easy using the following image:\nSource\nAfter some revisions, the end result was the following ad which we sent via email to the other students:\nThis is as far as my graphic design (well, putting together) skills go :P\n","date":1351036800,"expirydate":-62135596800,"kind":"page","lang":"en","lastmod":1741387190,"objectID":"f1173cf3bb417db7a0e17203961658de","permalink":"https://lcolladotor.github.io/2012/10/24/super-basic-illustrator-event-invitation/","publishdate":"2012-10-24T00:00:00Z","relpermalink":"/2012/10/24/super-basic-illustrator-event-invitation/","section":"post","summary":"Amanda and I are organizing a cultural student mixer for students in our department. One of the things we needed to do was invite everyone to attend. I like using computers, but graphic design is not something that I’m too excited about, but I still wanted to try something out.","tags":["Illustrator"],"title":"Super basic Illustrator: event invitation","type":"post"},{"authors":null,"categories":["rstats"],"content":"The other day I learnt about the existance of the colors() vector in R which specifies all the character-based colors like “light blue”, “black”, etc. So I made a simple plot to visualize them all. Here’s the code:\nmat \u0026lt;- matrix(1:length(colors()), ncol = 9, byrow= TRUE) df \u0026lt;- data.frame(col = colors(), x = as.integer(cut(1:length(colors()), 9)), y = rep(1:73, 9), stringsAsFactors=FALSE) plot(y ~ jitter(x), data = df, col = df$col, pch=16, main = \u0026#34;Visualizing colors() split in 9 groups\u0026#34;, xlab = \u0026#34;Group\u0026#34;, ylab = \u0026#34;Element of the group (min = 1, max = 73)\u0026#34;, sub = \u0026#34;x = 3, y = 1 means that it\u0026#39;s the 2 * 73 + 1 = 147th color\u0026#34;) And the plot:\n","date":1350604800,"expirydate":-62135596800,"kind":"page","lang":"en","lastmod":1741387190,"objectID":"387146c309aa40a502a132f764a2324c","permalink":"https://lcolladotor.github.io/2012/10/19/visualizing-colors/","publishdate":"2012-10-19T00:00:00Z","relpermalink":"/2012/10/19/visualizing-colors/","section":"post","summary":"The other day I learnt about the existance of the colors() vector in R which specifies all the character-based colors like “light blue”, “black”, etc. So I made a simple plot to visualize them all.","tags":["Graphics"],"title":"Visualizing colors()","type":"post"},{"authors":null,"categories":["Computing"],"content":"Bitbucket announced their new “look” today. The goal is to make it more team friendly but I guess that they also wanted to make it look fresh.\nFor example, the overview page now has a quick summary:\nThat can be useful coupled with the simpler navigation tabs. But I think that the best of the new tools is the ability to comment at a given commit at any line change.\nThis gives a new dimension when working with a team. It’s independent of the version control system you are using, so this can be a drawback in a sense as you need to log into Bitbucket to see the comments. I guess that if you keep the main explanations inside commit messages, this new comment tool can be helpful when reviewing the code and/or solving merges.\nBitbucket thought about how to make these comments more visible, so they show as updates in the overview page. That’s great, otherwise you would have to go to each commit and check if there is anything new out there. Plus, there is an RSS feed for those of us that prefer to use these instead of browsing to a webpage to check if there is an update.\nTo foment the discussion when solving merges, they also have some new tools inside the “pull requests”:\nOverall, these changes make me happy and want to stay with Bitbucket. Though most of my collaborators use Github and the idea of having to get a new account is a HUGE wall. You wouldn’t think it is after having accounts for lots of other stuff, right? Well, remember that you can log into Bitbucket using OpenID:\n\u0026lt;3 Bitbucket\n","date":1349740800,"expirydate":-62135596800,"kind":"page","lang":"en","lastmod":1741387190,"objectID":"d66d31efc9283acb46f01308f03b1ec5","permalink":"https://lcolladotor.github.io/2012/10/09/bitbucket-revamped/","publishdate":"2012-10-09T00:00:00Z","relpermalink":"/2012/10/09/bitbucket-revamped/","section":"post","summary":"Bitbucket announced their new “look” today. The goal is to make it more team friendly but I guess that they also wanted to make it look fresh.\nFor example, the overview page now has a quick summary:","tags":["Bitbucket","Git","Mercurial"],"title":"Bitbucket revamped","type":"post"},{"authors":null,"categories":["JHU Biostat","Ideas"],"content":"During the last pre-happy hour seminar, Karl Broman talked about Why aren’t all of our graphs interactive? I didn’t know, but a few years ago Karl worked in the department and clearly promoted beer-drinking and is the heart of the department. I’m a fan of our pre-happy hour seminars since you have a get to listen to good/fun talks over a beer or two.\nBut I’m also a fan of reproducible research and useful graphics. I do most of this by using Sweave (for reproducibility) in LaTeX documents and with the R packages lattice, car, and plotrix, and some ggplot2 (I should use it more). Karl made his presentation using html (definitely check it out!) and inserted pretty interactive graphics. His talk got me really interested and I definitely need to pick up a few tools. For example, asciidoc or R Markdown can be useful for making html documents with R code. Specially if you want to write a report and you don’t want to deal with Sweave/Latex when making plots (can be a pain to know where they’ll show up). For the interactive side, D3 (and other tools Karl listed) can be useful to learn. But I might put this on a hold for some time. Maybe I’ll wait and see what others in the deparment are developing for R-D3 and embedding interactive plots in pdf files.\nI don’t think that it will be long before interactive plots make it to the journals. Specially for their web versions. Though, I still think that if you are showing a 3D plot, as the author you will have to give a few default views where you can clearly see something that you want to talk about instead of having the reader find that sweet spot. One problem that I don’t think has been solved yet is reproducible research on a cluster. Karl and others mentioned make as well as having if/else clauses where you either show the output or a cleaned up version of the code that you used to generate the output. Overall, there are many tools and tips I can learn from Karl. And I’m sure that I’m not the only one! Hopefully he’ll give tips on where to start (nothing is more tedious than reading UNIX man-files).\n","date":1349654400,"expirydate":-62135596800,"kind":"page","lang":"en","lastmod":1741387190,"objectID":"7f8c83dfaf728ece5c19d21c098de2fe","permalink":"https://lcolladotor.github.io/2012/10/08/why-arent-all-of-our-graphs-interactive/","publishdate":"2012-10-08T00:00:00Z","relpermalink":"/2012/10/08/why-arent-all-of-our-graphs-interactive/","section":"post","summary":"During the last pre-happy hour seminar, Karl Broman talked about Why aren’t all of our graphs interactive? I didn’t know, but a few years ago Karl worked in the department and clearly promoted beer-drinking and is the heart of the department.","tags":["Graphics"],"title":"Why aren't all of our graphs interactive?","type":"post"},{"authors":null,"categories":["Science","Ideas"],"content":"Last week I talked about online courses in my JHSPH-Biostat through Coursera post. Now I’m back to comment on An Online Bioinformatics Curriculum by David B. Searls. Sur Herrera pointed out this paper to me, and I have to say that if you are considering learning bioinformatics online it will be very useful to you. David Searls first goes through a history recap of online (free) courses. Notably, in the last year Coursera and other startups offered their first courses. MIT has also evolved and now offers MITx courses, where MIT does give certificates. For example, I’m a bit interested in the Introduction to Computer Science and Programming 6.00x course. It aims to cover a wide variety of topics which can be nice for a review/learning and is Python-based. The main body of David Searls’ paper is a huge list of summaries for the main courses out there for bioinformaticians. He covers several tracks depending on what subarea of bioinformatics you are interested in. For each summary, he recommends an specific course to take along with the main reasons why he prefers it over other options. If you have ever looked into OCW, Coursera, etc; you know this is a great resource. After all, there are lots of options for some courses like calculus and it can be a time drain to look through them before deciding which to take. This summary is the best part of the paper.\nDavid Searls ends it with a conclusion section and some tips on how to make the best of the available resources. How far can free online education go? Well, obviously for informatics it can go almost all the way compared to wet lab biology. Plus, you have to be organized/dedicated/motivated and a good self-learner. Even with all that, you still need good ideas to use as learning projects. If you are looking for one, I would take a look here and here where Jeff Leek lists some of his project suggestions.\n","date":1349568000,"expirydate":-62135596800,"kind":"page","lang":"en","lastmod":1741387190,"objectID":"d6d490c6ccf20fef555d832718e93414","permalink":"https://lcolladotor.github.io/2012/10/07/an-online-bioinformatics-curriculum/","publishdate":"2012-10-07T00:00:00Z","relpermalink":"/2012/10/07/an-online-bioinformatics-curriculum/","section":"post","summary":"Last week I talked about online courses in my JHSPH-Biostat through Coursera post. Now I’m back to comment on An Online Bioinformatics Curriculum by David B. Searls. Sur Herrera pointed out this paper to me, and I have to say that if you are considering learning bioinformatics online it will be very useful to you.","tags":["Coursera","Computing"],"title":"An Online Bioinformatics Curriculum","type":"post"},{"authors":null,"categories":["Fun"],"content":"02/27/12 PHD comic: ‘Inspired by true events’\nTotally what happened to me on Monday night! (whenever I saved this post as a draft :P, but it’s happening again now)\n","date":1349222400,"expirydate":-62135596800,"kind":"page","lang":"en","lastmod":1741387190,"objectID":"bfaa53090ef9037ae2cb447f530c6efa","permalink":"https://lcolladotor.github.io/2012/10/03/02/27/12-phd-comic-inspired-by-true-events/","publishdate":"2012-10-03T00:00:00Z","relpermalink":"/2012/10/03/02/27/12-phd-comic-inspired-by-true-events/","section":"post","summary":"02/27/12 PHD comic: ‘Inspired by true events’\nTotally what happened to me on Monday night! (whenever I saved this post as a draft :P, but it’s happening again now)","tags":["PhD Comics"],"title":"02/27/12 PHD comic: 'Inspired by true events'","type":"post"},{"authors":null,"categories":["Web"],"content":"Do you use Gmail as your primary email account? Primary, what? Well, I’m sure that you have your personal account somewhere and your work or university account too. You can either log into each email interface or you can integrate them to a single one.\nGmail makes this easy as you can go to the “Settings -\u0026gt; Accounts and Import” to set up Gmail to pull all of your email into it. In that same page you can configure Gmail to send email through your work/university accounts or at least camouflage it. That is all great, but as you will soon learn, Gmail pulls the emails from your other accounts at random intervals. It tries to do so in an intelligent way by pulling more frequently during the times of the day that you get more emails from those accounts. But you’ll soon realize that some emails get pulled an hour later.\nMaybe this is what you want. Specially if you get TONS of emails and you don’t want anyone to expect immediate replies from you, thus promoting more intelligent emails from them and hopefully reducing your email traffic load.\nBut maybe you don’t like this behavior. That’s where the ”Multiple Inbox” Google Lab comes in.\nYou can find it by going to “Settings -\u0026gt; Labs”. “Multiple Inbox” is designed to help those that have multiple Gmail accounts. But it also changes the behavior of the “refresh” button. Once you enable “Multiple Inbox”, the refresh button will automatically look for new emails in ALL of your accounts. Thus you will no longer have to go to “Settings -\u0026gt; Accounts and Import” to manually look for new emails by clicking on the “Check mail now” links. Note that “Multiple Inbox” creates automatic panes if you are using the default inbox. If you don’t like them, you can simply go to “Settings -\u0026gt; Multiple Inbox” and clear the default searches.\nEnjoy!\n[Edited: minor word change]\n","date":1349136000,"expirydate":-62135596800,"kind":"page","lang":"en","lastmod":1741387190,"objectID":"4f6694d3d04c5e39f724d9dd8ab63683","permalink":"https://lcolladotor.github.io/2012/10/02/check-all-your-accounts-for-emails-at-once-in-gmail/","publishdate":"2012-10-02T00:00:00Z","relpermalink":"/2012/10/02/check-all-your-accounts-for-emails-at-once-in-gmail/","section":"post","summary":"Do you use Gmail as your primary email account? Primary, what? Well, I’m sure that you have your personal account somewhere and your work or university account too. You can either log into each email interface or you can integrate them to a single one.","tags":["Gmail"],"title":"Check all your accounts for emails at once in Gmail","type":"post"},{"authors":null,"categories":["JHU Biostat","Web"],"content":"Have you heard of online education? If you are in the US or Mexico I’m sure that you have seen some ads about online universities. Well, that’s not the type of education I’m talking about. I’m talking about free high-quality education. For some years, the top option has been the Open Courseware (OCW) organized under the Open Courseware Consortium (OCWC). Back in 2009 I was pushed my undergrad (LCG-UNAM) to design and teach OCW-compliant courses. I even taught a course on R/Bioconductor and thought of it as a pilot OCW course. The first seven classes were video recorded. But that project hit a wall because many of the biology professors used slides that heavily relied on copyrighted material. For OCW courses you have to own the copyright of the material that you use (or get permission), so just the idea of having to re-do all the diagrams and figures was overwhelming. This hasn’t stopped some big universities like MIT from publishing OCW-compliant courses.\nRecently there’s been talk of the new horse in the race: Coursera. What is it? Well, according to themselves:\nWe are a social entrepreneurship company that partners with the top universities in the world to offer courses online for anyone to take, for free. We envision a future where the top universities are educating not only thousands of students, but millions. Our technology enables the best professors to teach tens or hundreds of thousands of students.\nThrough this, we hope to give everyone access to the world-class education that has so far been available only to a select few. We want to empower people with education that will improve their lives, the lives of their families, and the communities they live in.\nSo far, the motivation is similar to the OCW movement. However, one very big difference is that Coursera does offer certificates. Something which OCW courses do not. For example, MIT-OCW says:\nOCW is not an MIT education. OCW does not grant degrees or certificates. OCW does not provide access to MIT faculty. Materials may not reflect entire content of the course. Coursera courses do provide the entire content of the course. Well, this is slightly tricky since some professors use the same base material in the university-in-class courses but expand it beyond what is available through Coursera. Thus in a sense Coursera are more accesible courses with lesser requirements than the in-class versions. But compared to OCW, you have homeworks (which are graded) and can communicate with the faculty through the use of forums.\nOne advantage of OCW courses is that you can look at them whenever you want. For Coursera ones you have to sign up (and thus register to their system) and they are open for certain periods of time.\nCurrently, the Biostatistics Department at JHSPH is offering three courses through Coursera. These are Computing for Data Analysis by Roger D. Peng, Mathematical Biostatistics Boot Camp by Brian Caffo, and Data Analysis by Jeffrey Leek. The first two are introductory courses to using R and Biostatistics, respectively. I’m taking the in-class versions and highly recommend them to anyone that wants to get started in either topic. They both involve youtube videos and practice exercises. The videos themselves are great since they rehearse what they are going to say, used a high-quality audio recording room, tuned the audio, and included highlights in the slides so you can follow them easily. Right now you can go and sign up for these two courses!\nThe third one, Data Analysis, is more advanced and I’ll take it in-class next year. In addition, for now the sign up is closed for 2012 (you can go ahead and save a spot for 2013). All of these courses have a couple thousands students registered, which is great! I’m sure that the great majority will greatly benefit from them. To finish my post, I’ll leave you with their short introduction videos, which will tell you more than what I can via text!\nEnjoy!\n","date":1349049600,"expirydate":-62135596800,"kind":"page","lang":"en","lastmod":1741387190,"objectID":"afaf743b059c6db9aa8f21a2f8a50bab","permalink":"https://lcolladotor.github.io/2012/10/01/jhsph-biostat-through-coursera/","publishdate":"2012-10-01T00:00:00Z","relpermalink":"/2012/10/01/jhsph-biostat-through-coursera/","section":"post","summary":"Have you heard of online education? If you are in the US or Mexico I’m sure that you have seen some ads about online universities. Well, that’s not the type of education I’m talking about.","tags":["Coursera","rstats","Biostatistics"],"title":"JHSPH-Biostat through Coursera","type":"post"},{"authors":null,"categories":["Science","Ideas"],"content":"During this week’s journal club meeting Hilary Parker (homepage, blog) led the session on “Identifying influential and susceptible members of social networks”. Were there some speakers or why did she “lead the session”? By this I mean that Hilary tried a very different (and interesting) format this time. Instead of giving a talk, not a formal one like at seminars, she prepared a short presentation (publicly available here) that begins showing a 20 minute video. This video is by the author of the paper where he presents the key points of his research at another conference. The goal of this format was to get us to speed and hopefully provoke enough discussion to make the meeting highly interactive. Plus the author does a great job in his presentation.\nNow, given that it’s a biostat journal club, Hilary included some slides to explain the general Cox Proportional Hazard model before showing some of details used in the paper in question. I think that the change of format was a step in the right direction. Hopefully others will follow.\nAbout the paper itself, the topic is interesting since it shows a different view of the “data science” vs biostat discussion. The presenter is trying to convince computer scientists that they need to do some statistics too. Over here, we are poking our heads at whether we need to learn some computer science.\nIn addition, the author is in a different setting than academia or industry, which are commonly the two options. He is at NYU, and academic institution, but he is working closely with the industry (thus getting access to interesting data) and might be getting some consultation money along the way. Anyhow, given the recent talk from Amy Heineike on Quid (more in my previous post) there is a growing interest among students to learn more about the industry environment.\nI made a couple of comments during the discussion, which might be completely wrong. One is that I feel that in academia we care much more about bias and removing sources of error and it seems that in industry that’s not the main point. There you care more about making something useful which might be biased. You try to minimize it, but the judge are the clients. The second one is that in industry options like getting a larger sample are much more feasible. In the video, at some point the author shows that people eventually joined the app after getting massively spammed. Increasing the exposure is easy in this case, but imagine a public health survey that is carried out door by door. Increasing the number of houses visited is way more expensive.\nThe point is that the club meeting followed an interesting format, social networks seem fun to analyze, and industry vs academia is kind of a hot topic in our department right now.\n—\nThanks to Hilary for publicly sharing her journal club presentation.\n","date":1348790400,"expirydate":-62135596800,"kind":"page","lang":"en","lastmod":1741387190,"objectID":"3fe2926680b0878743b2cf418d0f99c2","permalink":"https://lcolladotor.github.io/2012/09/28/learning-about-social-networks-through-an-interactive-presentation/","publishdate":"2012-09-28T00:00:00Z","relpermalink":"/2012/09/28/learning-about-social-networks-through-an-interactive-presentation/","section":"post","summary":"During this week’s journal club meeting Hilary Parker (homepage, blog) led the session on “Identifying influential and susceptible members of social networks”. Were there some speakers or why did she “lead the session”?","tags":["Academia","Industry","Network"],"title":"Learning about social networks through an interactive presentation","type":"post"},{"authors":null,"categories":["JHU Biostat"],"content":"Just like most scientific departments, we have a seminar (weekly over here) where very bright people come to us to talk about their work. Being a Biostatistics department, we mostly get faculty from other Biostatistics departments from universities to talk to us. This week was quite different. Amy Heineike from Quid gave us a talk describing their product, which fits perfectly in what is now called “data science”. You can see Amy at the end of the table in the picture below.\nSo what is Quid? It’s a start up tech company that provides either their software or reports derived from it that help big companies (a) analyze a field, (b) look at what the competition is doing, (c) take informed decisions (helpful for marketing). The short video below describes Quid in a more general way, check it out!\nAs Amy Heineike described in her talk, the three common decision-taking pathways are:\nSomeone follows their own intuition. Say a big shot that thinks he knows where the world is going. Someone with decision power asks others to generate reports for her/him. That is, lots of manual work where some read, consult others, etc then they summarize the information in a report. Similar to the above one where lots of people gather the information, then a program is run and the decision is pretty much made by the computer. The Quid paradigm is to use the computer to gather all the information and then have a human(s) look at a network with a very cool 3D tool to assimilate the information and decide themselves. The argument is that the human brain is very powerful for visual pattern recognition and can out-perform computers. At first I felt that you can do the network part with a software like Cytoscape which I find to be very powerful for network analysis. But the pipeline used by Quid is much more extensive and it’s an all-in-one bundle.\nAnother key argument in favor of Quid is that most of the information shared is done in a list format. Like google search results, powerpoint bullet points, your facebook feed, etc. But who came up with the ranking? How are things related? That’s when you need a network representation.\nI recommend taking a look at their technical overview page where they have the main steps outlined. But needless to say, they depend strongly on the natural language processing early steps. Their 3D tool looked very interesting and I love to play with it. Amy Heineike actually poked us by showing a video of a short session using the software that was designed so we would want to have a go with Quid. I, as many others, were hooked! Sadly, Quid’s software is not the kind that academics can go buy for now.\nI found the example using “synthetic biology” as the query to be pretty interesting. Sadly I don’t have a picture, but one of the features that seems very powerful is when you change to a 2D display. In it, you have the time on the X-axis and the number of articles (well, any kind of input file Quid can use) on the Y-axis. By clicking on a point (which corresponds to a node in the network 3D environment) you can then visualize all the connections that are directly linked to it. Thus you have a scatterplot with a 2D network on top of it. That information can be really useful to understand the flow of information. The specific example was how someone proposed years ago that a specific kind of application was possible, time later grants on the subject were announced, and more close to the present he got a grant, then other grants and results were publicized.\nNow, Quid has some flaws. For instance, one hot question was how to control the threshold that determines whether two nodes are connected or not. The answer was something like this: experts in their fields have validated the results for queries related to them. Not very convincing for a biostat crowd. Another one was how to control/remove/correct bias. Amy Heineike replied that you need to learn where the data used by Quid is like. For example, when looking at companies the number of news articles mentioned is linked to how efficient/big their public relations office is.\nNevertheless, Quid’s product is very interesting. Plus, I feel that part of our tool-box as Biostatisticians is visualizing data in ways that allow us to understand what is going on. As for working at Quid or doing anything alone the line, we definitely need to learn more about computer science. After all, you need incredibly fast algorithms and code to work with enormous data sets. ——\nPS Amy Heineike might develop a Pubmed scrapper for Quid. Meaning that Quid would be able to access citations data. Then it would be very cool to use a few “seed” papers that you are interested in to find the complete history behind them and any other papers similar to them. There might another group out there working in your field that you don’t know about! Which I think happens more frequently that what you think. Specially if you don’t look abroad.\n——\nEdit: I had completely forgotten that I had read about Amy …","date":1348790400,"expirydate":-62135596800,"kind":"page","lang":"en","lastmod":1741387190,"objectID":"74239950c066f992ae395352ef86ef03","permalink":"https://lcolladotor.github.io/2012/09/28/quid-@biostat-jhsph/","publishdate":"2012-09-28T00:00:00Z","relpermalink":"/2012/09/28/quid-@biostat-jhsph/","section":"post","summary":"Just like most scientific departments, we have a seminar (weekly over here) where very bright people come to us to talk about their work. Being a Biostatistics department, we mostly get faculty from other Biostatistics departments from universities to talk to us.","tags":["Network"],"title":"Quid @Biostat-JHSPH","type":"post"},{"authors":null,"categories":["Computing","JHU Biostat"],"content":"Last week I gave a presentation during our computing club on how to use git (a version control system). I used as a motivating example the first steps of creating your own academic webpage. The goal was to make it interesting to both new students (who might have been more interested on the webpage part) and older students (for whom version control should be a must). The slides and all the material is publicly available through the following Bitbucket repository: https://bitbucket.org/lcolladotor/html_git_intro/overview. You can access the slides by clicking on “Source”, “slides” and then “html_git.pdf”.\nFor the talk, I tried to make it more interactive but at the same time I wanted to make sure that the material could work for reference in the future. For example, I added a commands.txt file so anyone following me could easily copy-paste the commands. By the way, for Git Bash in Windows, you paste stuff by using the insert key instead of the usual “ctrl + v” shortcut.\nI’m posting about it as it could be useful to other people, so feel free to share it.\nEnjoy!\n","date":1348444800,"expirydate":-62135596800,"kind":"page","lang":"en","lastmod":1741387190,"objectID":"df51d2ef0b0bd1ffffaeecdef4001698","permalink":"https://lcolladotor.github.io/2012/09/24/introducing-git-while-making-your-academic-webpage/","publishdate":"2012-09-24T00:00:00Z","relpermalink":"/2012/09/24/introducing-git-while-making-your-academic-webpage/","section":"post","summary":"Last week I gave a presentation during our computing club on how to use git (a version control system). I used as a motivating example the first steps of creating your own academic webpage.","tags":["Git","Website","Bitbucket"],"title":"Introducing Git while making your academic webpage","type":"post"},{"authors":["Leonardo Collado-Torres"],"categories":null,"content":" ","date":1348158877,"expirydate":-62135596800,"kind":"page","lang":"en","lastmod":1621020950,"objectID":"aa921a1ba07e74e13a1b75123d168e8c","permalink":"https://lcolladotor.github.io/talk/git2012/","publishdate":"2012-09-20T16:34:37Z","relpermalink":"/talk/git2012/","section":"talk","summary":"Introduction to git and introduction to website creation at the same time for the JHU Biostat Computing Club","tags":["Computing Club"],"title":"Introducing Git while making your academic webpage","type":"talk"},{"authors":null,"categories":["Computing"],"content":"I consider myself a fan of using version control for bioinformatics/biostatistics (or any text based, like code) project. Yet my knowledge of version control systems is quite limited. I’ve used Mercurial for some time, but I haven’t ventured much beyond the basic commands and some GUIs for merging.\nI don’t recall how it all went, but I remember reading that Subversion (SVN) was much better than CVS. Also, the Bioconductor project uses SVN. Before that I really learnt how to use SVN, someone from the Bioconductor devel list pointed me to Git/Mercurial. Around the same time I read “A quick guide to organizing computational biology projects\u0026#34; by William Noble, which further convinced me to start using a version control system. I \u0026#34;educated\u0026#34; (a tiny bit) myself on the topic with Wikipedia’s entries on revision control and distributed revision control.\nI wasn’t sure whether to use Mercurial or Git, but at the time Bitbucket only supported Mercurial repositories. It felt pretty easy to use, specially after reading the guide whose examples covered pretty much all I needed. By the way, I highly recommend using Bitbucket now (whether for Mercurial or Git repositories) as they offer unlimited private repositories to anyone with an academic email account.\nNow for my Advanced Methods class by Brian Caffo (check out his Mathematical Biostatistics Boot Camp Coursera free online course) I need to learn how to use Git. That lead me to check some Git vs Mercurial posts such as:\nGit vs Mercurial: Why Git? Git vs Mercurial: Why Mercurial? Curiosity and another reason lead me to watch the video from above. It helped me to understand the basic differences between Git and Mercurial, plus it reassured me that skipping SVN was a good thing. I might still need to learn SVN properly, but at least through Git-SVN or HgSubversion it seems that I can dodge the bullet.\nI’ll come back once I’ve tried out Git, but for now it seems that SourceTree will be a great tool to have. It works with Bitbucket and Github (free for open source, gotta pay for private repositories).\nTo finish this post, if you are new to the topic you should check out:\nWhat is Version Control: Diff and Patches What is Version Control: Centralized vs DVCS Well, even without knowing much about these tools you probably already use some kind of version history thanks to Dropbox and Google Docs. PS I found lots of stuff here.\n","date":1346803200,"expirydate":-62135596800,"kind":"page","lang":"en","lastmod":1741387190,"objectID":"d19f7a1d927b3959b44e65cd0f87de88","permalink":"https://lcolladotor.github.io/2012/09/05/version-control-need-to-learn-git/","publishdate":"2012-09-05T00:00:00Z","relpermalink":"/2012/09/05/version-control-need-to-learn-git/","section":"post","summary":"I consider myself a fan of using version control for bioinformatics/biostatistics (or any text based, like code) project. Yet my knowledge of version control systems is quite limited. I’ve used Mercurial for some time, but I haven’t ventured much beyond the basic commands and some GUIs for merging.","tags":["Mercurial","Git"],"title":"Version control: need to learn Git","type":"post"},{"authors":null,"categories":["Fun"],"content":"John Bohannon wrote Scientists’ Photos Reveal Their Inner Mr. Spock which I found funny in a science-curious kind of way. I hadn’t thought about the message you could be sending depending on which cheek you show. I had only noticed that people like to show more serious-looking photos of themselves and sometimes make it an obviously funny one. I have to say too that some of the pages from my co-workers don’t even show a picture. I guess that’s a more recent trend to make it more “professional” looking. Dunno.\nI have to guess that dead center-looking pictures are rare. At least when you look at Rachael Jack’s one it stands out. It reminds me of passport pictures. For my new academic site I choose one that doesn’t look serious, I wanted a fun one! Plus I make it obvious which country I’m from ^^.\nFor some reason this doesn’t surprise me:\n\u0026gt; while English language and literature scholars showed the left cheek and engineers showed the right, psychologists were more difficult to categorize. ","date":1346284800,"expirydate":-62135596800,"kind":"page","lang":"en","lastmod":1741387190,"objectID":"e6732ee1957b76c70a91b92b022a5f4d","permalink":"https://lcolladotor.github.io/2012/08/30/homepage-photos-which-cheek-you-show-says-something/","publishdate":"2012-08-30T00:00:00Z","relpermalink":"/2012/08/30/homepage-photos-which-cheek-you-show-says-something/","section":"post","summary":"John Bohannon wrote Scientists’ Photos Reveal Their Inner Mr. Spock which I found funny in a science-curious kind of way. I hadn’t thought about the message you could be sending depending on which cheek you show.","tags":["Science"],"title":"Homepage photos: which cheek you show says something?","type":"post"},{"authors":null,"categories":["Science"],"content":"Adam Ruben shares his answer to whether science is cool or not. Since “cool” depends on the current trends, this question is set on the recent landing of Curiosity. It’s the landrover that recently landed on Mars and has been sending some pictures back. Anyhow, check his answer here. I liked this part:\n\u0026gt; If the Mars landing draws students to science, it won’t be because they witnessed science doing something cool. It’ll be because they witnessed science doing something human, something genuine, something legitimately appealing on its own merits. Something scientific.\nPicture taken from his commentary piece.\n","date":1346025600,"expirydate":-62135596800,"kind":"page","lang":"en","lastmod":1741387190,"objectID":"580071ea07e57a425b605d6b2ea6bccb","permalink":"https://lcolladotor.github.io/2012/08/27/is-science-cool/","publishdate":"2012-08-27T00:00:00Z","relpermalink":"/2012/08/27/is-science-cool/","section":"post","summary":"Adam Ruben shares his answer to whether science is cool or not. Since “cool” depends on the current trends, this question is set on the recent landing of Curiosity. It’s the landrover that recently landed on Mars and has been sending some pictures back.","tags":["Science"],"title":"Is science cool?","type":"post"},{"authors":null,"categories":["Computing","JHU Biostat","rstats"],"content":"Jumping on the train set by Hilary Parker “The Setup (Part 1)\u0026#34; and Alyssa Frazee “my software/hardware setup”, I’m going to share my setup and hopefully add something new. They both did a great job already, so make sure you read their posts!\nI have some experience with all three main OS: Windows, Linux and Mac. That being said, I know some of the basic stuff for each but I surely use Google very frequently to get help. I used to have a dual Windows / Linux (Ubuntu) set up but now I have a Windows laptop/desktop (it’s a monster :P) at home and I’m happy working with my Mac. I’m going to start by mentioning the software I use(d) in each OS and then add some other tools that I really like.\nWindows\nText editor: Notepad++. It outperforms Notepad by light years! A must for me is the “View -\u0026gt; Word wrap” option. I would definitely go to “Settings -\u0026gt; Preferences -\u0026gt; New Document/Default Directory” and change the new document format from Windows (Dos) to Unix. This will save you time later when you want to work on a Unix system like the cluster. If you didn’t, you can change a specific document’s EOL (end of line) by using “Edit -\u0026gt; EOL conversion -\u0026gt; UNIX format”. Another feature that I like is the “Search -\u0026gt; Replace…” which allows you to use regular expressions (like Perl). Statistical software: R of course! It’s best to do a custom installation and choose a directory without spaces in it. That will help later (further below). If you want to be convinced to join the R community read Data Analysits Captivated by R’s power and R You Ready for R? or just take a look at what others are using. Remember that the R project is open source, free and easy to contribute to. If you end up choosing Excel as your statistical software, well, there is no hope for you!! R code editor: Notepad++ with NppToR. For a long time I used Emacs modified to work with Windows by Vincent Goulet available here. It works great and saves you quite a bit of setup time. XEmacs is another option that a friend of mine used, but it never convinced me. Anyhow, I ended up changing from Emacs to Notepad++ with NppToR because I could: Force quit R (and not lose code changes) in case I crashed R by doing something stupid like printing something huge or w/e :P Access help pages in a separate window. I’m sure you can do it too with Emacs, but I was just lazy to configure it. Shorter shortcuts Later on I found the NppToR to PuTTy feature which is very useful. You can create an R syntax dictionary (or something like that) in Notepad++ which will scan all your R packages and add the function names so they are colored when you type them. Also Notepad++ will auto-complete some function names and show you the arguments. Great stuff! (Forgot the name, so… google it :P) SSH: PuTTY. As said before, works well with Notepad++ and NppToR. SCP: WinSCP. There are others that work too like Filezilla but well, WinSCP does the job well. PDF viewer: Adobe Acrobat Professional. I’m using the X version now. I like how I can highlight, underline, cross out, free hand, sticky note, combine files into a single pdf, combine pdfs, and change the highlight colors easily. It also has a change tracker (kind of like Word has). I’ve seen other use PDF Annotator which is available for free for Hopkins students. Anyhow, I simply love Acrobat for reading papers. LaTeX: MiKTeX. For writing TeX files I used either Emacs or Notepad++. There is another software which has drop down menus and the like called WinEdt. I got used to typing LaTeX from scratch, well, I have a template.Rnw somewhere. Oh yeah, I always use Sweave when writing TeX files (even if I don’t use R). R reports: Sweave by Friedrich Leisch, one of the champions of reproducibility! To learn more about Sweave first read this pdf by Nicola Sartori. This is another Sweave demo by Charles J Geyer. Check out this great Windows Sweave troubleshooting page by John D Cook. Building R packages from source. You will definitely need Rtools installed. I would also install QPDF which can be used by R to compress your pdf files, which is a good thing if you want to have a small-sized tarball. Last but not least, check out Building R packages for Windows by Rob J Hyndman. Learn to modify your PATH! Check 1.3 from the previous link by Rob J Hyndman. If you are going to use Sweave, it’s best to add to your PATH the path for the directory containing your Sweave.sty file so that you won’t need to copy it to every single directory. This is why it pays off to do an R custom installation and put it in C:/R/R-current-version or something like that instead of C:/Program Files/ bla bla with spaces. It used to be more important a few years ago. Also, I created a sw.bat file and put it somewhere where my PATH would find it. That sw.bat file ran Sweave, pdflatex twice, then bibtex and finally opened the pdf file. PDF viewer for LaTeX files. I only learnt about pdf sync and the like a year ago. You should google how to set this up with SumatraPDF (Adobe Acrobat …","date":1345680000,"expirydate":-62135596800,"kind":"page","lang":"en","lastmod":1741387190,"objectID":"58a6b9c9af617005df400fc5927c9d47","permalink":"https://lcolladotor.github.io/2012/08/23/setting-up-your-computer-for-bioinformatics/biostatistics-and-a-compedium-of-resources/","publishdate":"2012-08-23T00:00:00Z","relpermalink":"/2012/08/23/setting-up-your-computer-for-bioinformatics/biostatistics-and-a-compedium-of-resources/","section":"post","summary":"Jumping on the train set by Hilary Parker “The Setup (Part 1)\" and Alyssa Frazee “my software/hardware setup”, I’m going to share my setup and hopefully add something new. They both did a great job already, so make sure you read their posts!","tags":["Bioconductor","LaTeX"],"title":"Setting up your computer for bioinformatics/biostatistics and a compedium of resources","type":"post"},{"authors":null,"categories":["UNAM"],"content":"Did you know that next year will be the International Year of Statistics? Well, you probably didn’t! There is a site organizing the activities and listing the institutions that morally support the celebration. I’m happy to see my current work place listed there but at the same time concerned that the National Autonomous University of Mexico is not in it.\nMaybe it’s not that surprising since there is no big Statistics department at UNAM. Googling I found a Department of Probability and Statistics listing 14 faculty members and it seems that it was last updated in 2007. Not looking good! There is a more recent site listing 3 staff members and it seems to be geared towards helping students. I did find a graduate program on Mathematical Sciences specializing in Applied Statistics and a short diploma course on Probability and Statistics. I think that most statisticians at UNAM work in institutes without Statistics in the name. I hope that there are plenty more out there!\nThere are several other Mexican institutions listed (just look at the participants list and search “Mexico” in your browser). Looking at the list highlights how vastly spread is the field. By that I mean that there are plenty of organizations across the world that teach it, and use it. I’m also happy to see that most of the activities (which are almost exclusively conferences) are not in the US. I’m sure that by 2013 there will be plenty more activities listed and hopefully some public outreach events.\n","date":1345075200,"expirydate":-62135596800,"kind":"page","lang":"en","lastmod":1741387190,"objectID":"9c84494401076bdf3f145789b113a6d2","permalink":"https://lcolladotor.github.io/2012/08/16/international-year-of-statistics-coming-up-soon/","publishdate":"2012-08-16T00:00:00Z","relpermalink":"/2012/08/16/international-year-of-statistics-coming-up-soon/","section":"post","summary":"Did you know that next year will be the International Year of Statistics? Well, you probably didn’t! There is a site organizing the activities and listing the institutions that morally support the celebration.","tags":["Statistics"],"title":"International Year of Statistics: coming up soon!","type":"post"},{"authors":null,"categories":["Fun"],"content":"05/9/12 PHD comic: ‘Grad Stereogram’Is there really something hidden in the pic? I couldn’t see it :P I guessed that there shouldn’t be anything from the text, but just in case I checked. ","date":1336608000,"expirydate":-62135596800,"kind":"page","lang":"en","lastmod":1741387190,"objectID":"801233778427de0976c5a46ecfd3fefc","permalink":"https://lcolladotor.github.io/2012/05/10/05/9/12-phd-comic-grad-stereogram/","publishdate":"2012-05-10T00:00:00Z","relpermalink":"/2012/05/10/05/9/12-phd-comic-grad-stereogram/","section":"post","summary":"05/9/12 PHD comic: ‘Grad Stereogram’Is there really something hidden in the pic? I couldn’t see it :P I guessed that there shouldn’t be anything from the text, but just in case I checked.","tags":["PhD Comics"],"title":"05/9/12 PHD comic: 'Grad Stereogram'","type":"post"},{"authors":null,"categories":["Fun"],"content":"\nMore here.\n(Saw it from a fb friend).\n","date":1335571200,"expirydate":-62135596800,"kind":"page","lang":"en","lastmod":1741387190,"objectID":"bb31d22eb6cb271f2fb6d2edc2c35cfc","permalink":"https://lcolladotor.github.io/2012/04/28/pi/","publishdate":"2012-04-28T00:00:00Z","relpermalink":"/2012/04/28/pi/","section":"post","summary":"More here.\n(Saw it from a fb friend).","tags":["Math"],"title":"Pi","type":"post"},{"authors":null,"categories":["Fun"],"content":"\nI love the “I went to have a few beers with my friends”!\n","date":1331164800,"expirydate":-62135596800,"kind":"page","lang":"en","lastmod":1741387190,"objectID":"591035c104f93c9c0dcd241e23fb5733","permalink":"https://lcolladotor.github.io/2012/03/08/phd-comics-about-beers/","publishdate":"2012-03-08T00:00:00Z","relpermalink":"/2012/03/08/phd-comics-about-beers/","section":"post","summary":"I love the “I went to have a few beers with my friends”!","tags":["PhD Comics"],"title":"PhD Comics about beers!","type":"post"},{"authors":null,"categories":["Science"],"content":" Great video! Thank you aunt for sending it to me =)\n","date":1330560000,"expirydate":-62135596800,"kind":"page","lang":"en","lastmod":1741387190,"objectID":"1e4355a348218b718ed723876aa8d56e","permalink":"https://lcolladotor.github.io/2012/03/01/pollination-video/","publishdate":"2012-03-01T00:00:00Z","relpermalink":"/2012/03/01/pollination-video/","section":"post","summary":"Great video! Thank you aunt for sending it to me =)","tags":["Science"],"title":"Pollination video","type":"post"},{"authors":null,"categories":["Paper comments","Ideas"],"content":"I’m in the process of catching up with all the posts from SimplyStatistics that I didn’t read during the break. Doing so I found a very interesting post on p-values (more below)\nsimplystatistics:\n\u0026gt; This post written by Jeff Leek and Rafa Irizarry.\n\u0026gt; The p-value is the most widely-known statistic. P-values are reported in a large majority of scientific publications that measure and report data. R.A. Fisher is widely credited with inventing the p-value. If he was cited every time a p-value was reported his paper would have, at the very least, 3 million citations* - making it the most highly cited paper of all time. \u0026gt; Read More\nIt’s like the p-value is a necessary evil. The post is indeed a great read, but what caught my attention was the following statement:\n\u0026gt; The advent of new measurement technology has shifted much of science from hypothesis driven to discovery driven making the existing multiple testing machinery useful.\nI’m taking a class with Chuck Rohde on probability with a strong philosophical component. That lead me to ask him recently how he would try to convince a biologist that he should believe/trust statistics. To explain myself a bit more, I asked the question as I’ve been in environments where people follow their intuition on what is significant or not and disregard whatever statistics says on the same data. So in the past I’ve been in discussion where I’m the one trying to convince others that statistics say something is not significantly different. I don’t think that I communicated my question correctly as Rohde’s answer is that whenever he says a +- on count data we (as statisticians) are not doing something right! He also reflected on the past as at some time people were quite into mathematical biology, a field that has either died out or transformed into new fields (systems biology comes to mind). Will the same happen to genomics? *Sound of a coin flipping in the air* I don’t have a clue!\nIn a sense, the post at SimplyStatistics approaches the same issue I was trying to ask Rohde:\n\u0026gt; Why not explain to our collaborator that the observation they thought was so convincing can easily happen by chance in a setting that is uninteresting. […] In general, we find p-value to be superior to our collaborators intuition of what patterns are statistically interesting and which ones are not.\nTo end the post, I invite you to read the paper A Brief History of the Hypothesis by David Glass and Ned Hall from back in 2008. It’s one of my all time favorites. I’ve read it a few times and while my memory distorts what they really wrote, in my mind it’s a great summary with a message: it’s time to abandon hypothesis-driven science and continue with question-driven science involving building models from data and not from our hypothesis. Here are a few quotes from their paper:\n\u0026gt; We propose that building hypotheses should be abandoned in favor of posing a straightforward question of a system and then receiving an answer, using that answer to model reality, and then testing the reproducibility and predictive power of the model, modifying it as necessary.\nThey end their paper with:\n\u0026gt; Thus, although a hypothesis might have been thought to be necessary in the past, it no longer seems to be so. It is better to see science as a quest for good questions to try to answer, rather than a quest for bold hypotheses to try to refute.\nDo you agree?\n","date":1327881600,"expirydate":-62135596800,"kind":"page","lang":"en","lastmod":1741387190,"objectID":"67c9d96da31019129b730da145fb0f22","permalink":"https://lcolladotor.github.io/2012/01/30/p-values-and-statistics-phylosophy/","publishdate":"2012-01-30T00:00:00Z","relpermalink":"/2012/01/30/p-values-and-statistics-phylosophy/","section":"post","summary":"I’m in the process of catching up with all the posts from SimplyStatistics that I didn’t read during the break. Doing so I found a very interesting post on p-values (more below)","tags":["Paper comments","Statistics"],"title":"P-values and Statistics phylosophy","type":"post"},{"authors":null,"categories":["Web"],"content":"As a minor addition to my previous posts about setting up a blog, I want to detail a bit more how to synchronize your AddThis social sharing statistics (AddThis Analytics) with Google Analytics.\nThe main help file explaining how to do so has been a bit confusing for me. Though, in part that’s because I didn’t read it completely. Plus there were a few things I didn’t know.\nFirst, Google Analytics (GA) has two ways in which you can add it to your site: synchronous and asynchronous. There are a few posts around, like this one, explaining the difference. Basically, the asynchronous mode is supposed to give your site faster load times (negligible normally) and most importantly more complete data in cases where people close your site before it finishes loading.\nI prefer the asynchronous mode, and the recommendation is to include the script tage before the end of the head tag. In a few cases in Tumblr’s free blog themes, this script is included at the bottom of the html code. So, you might be interested in changing this otherwise the great advantage of the asynchronous mode is lost: the page has to load entirely to report stuff to GA.\nOnce you do so, note how the AddThis manual has a note that the AddThis script has to go after the GA script. I didn’t read this the first time and I was quite puzzled when no social events were showing up in the GA report.\nNext, compared to ShareThis, AddThis social events will be shown in your GA report as “facebook”, “twitter”, etc instead of “ShareThis: facebook” (or something like that). That’s only true if you included the “data_ga_social : true” part in the code. Otherwise GA will only shown under the “Social” tab the Google +1 clicks. In short: use the GA asynchronous code before the end of the head tag. Add the AddThis script tags below it. Happy social sync :)\nI have to say that so far I like the AddThis Analytics way more than Google Analytics for the social stats. Part of it is the “viral lift” percent that AddThis shows. The other part is that it seems to contain more data. Though it might be because I just fixed the sync.\nYou might want to read the:\nAddThis GA sync announcement at AddThis.com Another AddThis tip about how to do the sync The post on GA’s blog explaining a tiny bit about the difference between ShareThis and AddThis sync to GA. ","date":1327622400,"expirydate":-62135596800,"kind":"page","lang":"en","lastmod":1741387190,"objectID":"537a8a17d014c7caa48075c4a984f752","permalink":"https://lcolladotor.github.io/2012/01/27/correctly-synching-addthis-and-google-analytics-social-stats/","publishdate":"2012-01-27T00:00:00Z","relpermalink":"/2012/01/27/correctly-synching-addthis-and-google-analytics-social-stats/","section":"post","summary":"As a minor addition to my previous posts about setting up a blog, I want to detail a bit more how to synchronize your AddThis social sharing statistics (AddThis Analytics) with Google Analytics.","tags":["Blog"],"title":"Correctly synching AddThis and Google Analytics social stats","type":"post"},{"authors":null,"categories":["Paper comments"],"content":"I’ve been recently impressed by Steven Salzberg talk as you might have noticed, and browing his home page I stumbled upon his opinion piece (also by James Yorke): Beware of mis-assembled genomes.\nIt’s a short note published in 2005, but damn, can anyone deny that it fits perfectly for today’s state of the art in the de novo genome assembly field? I bet no one will. For instance, it’s a solid statement to say:\n\u0026gt; The source of most mis-assemblies is, as it has always been, repeats. He didn’t add a “will always be” or “will be for at least 7 years more” now that we are in 2012, but it feels like this will be the case until we can get accurate (and cheap) reads that span even the longest repeat. Well, maybe we don’t need such huge reads as people have been able to find large genome duplications. And as I said in my previous post, I’m still surprised by how careless the human genome assembly was carried out as they didn’t track their own steps. I was hoping that wasn’t the case, but clearly it is:\n\u0026gt; Indeed, many of the original assemblies of parts of the human genome were done in the mid- and late-1990s, and are now lost. I’m also impressed by how accurate Steven and James’ prediction was when they forsaw that people were going to be misled in judging assembly quality by contigs size without taking into account mis-assemblies. They also called upon the bioinformatics community to take action in evaluating genome assemblies. Due to the amount of data nowadays, it feels like a inhuman (well, incluster as infeasible by high power clusters :P, well, incomputable is the correct term) task. But with some funding, I bet Salzberg and colleagues could find a way to do so. At least partially. Yet, as with anything, you need motivation, and I’m note sure they are motivated to clean up the mess. ","date":1327536000,"expirydate":-62135596800,"kind":"page","lang":"en","lastmod":1741387190,"objectID":"950d81623bc345f8c61a11ebbe9200b9","permalink":"https://lcolladotor.github.io/2012/01/26/beware-of-mis-assembled-genomes-still-valid-today/","publishdate":"2012-01-26T00:00:00Z","relpermalink":"/2012/01/26/beware-of-mis-assembled-genomes-still-valid-today/","section":"post","summary":"I’ve been recently impressed by Steven Salzberg talk as you might have noticed, and browing his home page I stumbled upon his opinion piece (also by James Yorke): Beware of mis-assembled genomes.","tags":["De novo assembly","Genomics","Paper comments"],"title":"Beware of mis-assembled genomes: still valid today!","type":"post"},{"authors":null,"categories":["Paper comments"],"content":"During this week’s Genomics seminar at the Genome Cafe in the Biostats department, Steven Salzberg gave a talk on his team new published paper: GAGE: A critical evaluation of genome assemblies and assembly algorithms. I worked on a few assembly projects during my time at Winter Genomics, but that was not the main reason why I was immediately submerged into his talk. I think that it was due to his bold comments since comparing genome assemblers is a, hmm…, delicate issue. I really like the confidence he has on his work and the way he projects it when he talks. It might be too preachy for some, but I like it. Plus it helps that I completely agreed on two key points that differentiate GAGE from it’s competitors: dnGASP and Assemblathon.\nFirst, GAGE uses real data sets instead of simulated ones. I know that some might argue that a given data set can have specific properties that are not general or that it’s biased to a certain assembler. It also feels a bit funny, because I started out assembling simulated data too. It certainly had its uses as I learnt a lot. But once you encounter a real data set you learn how complicated things can be, and it can be quite messy as no one gives you perfectly clean data. I haven’t read much about GAGE’s competitors, but regardless of how they simulate their data, I completely agree with Steven that GAGE has the advantage by using four real data sets. Plus, they were quite sensible when choosing the four data sets as they are Illumina data (the most common) with frequently used read sizes and library types. Note that even the bacterial genome have more than one replicon. The second key point is that the GAGE team made public all the data and assembly recipes available through their official site (which has a great summary in from of a FAQ explaining the project and key differences). They have certainly made an effort to guarantee the reproducibility of their results, which is hard to do and hasn’t been done before. It’s a sad feeling that it took so long for someone to focus on reproducibility. So it feels wrong that they have to stress out how unique this feature is on their paper, but they definitely had to. Hm… can anyone reproduce the human genome assembly? I’m not talking about someone reading the paper and doing it on their institution computers, but someone from the author team. I hope the changelog is saved at least in some kind of repository.\nAnother important difference between GAGE and say Assemblaton, is that the for GAGE an in-house team ran the assemblers instead of asking the authors of each program to fine tune their results. If you had asked me a year ago, I would surely had supported the idea of asking the authors to run their programs. After all, even if you read all the documentation it’s the authors who know the best tricks on how to use their assemblers (or should be very good users). Yet, I can see the point that in reality it’s not the authors who run their code for each application. It’s a person or team of bioinformaticians (or a biologist struggling to death with UNIX) that has read the manual \u0026amp; papers (hopefully) from a few tools and decided which is his favorite one. During this process they probably ran a few of the assemblers with a small parameter scan and compared the results. The GAGE pipeline is very similar and hence feels much real. They obviously did this process in a more rigorous way and made sure the conditions allowed comparing the assemblers.\nOne of the steps common to all of their recipes was to run Quake: quality-aware detection and correction of sequencing errors. I didn’t know about this specific tool before, but I did know about the idea. Basically, you plot the distribution of the k-mers multiplicity from your data and do something to those that are possible errors (those k-mers that are unique or have very low multiplicity compared to the expected value); most commonly you try to correct them and if you can’t, you discard them. That’s a very broad explanation and I’m sure that interested readers will download the original paper. Anyhow, the point is that they cleaned the data sets prior to using any assembler. I couldn’t agree more to the sentence:\nHigh-quality data can produce dramatic differences in the results\nRunning some kind of preprocessing cleaning tool should help, but you can’t do miracles with crappy data. This post is getting huge, so I’ll jump to some points I’d like to highlight though it’ll still be very long.\nFirst, I’m amazed by the simple concept that is “N50 corrected”. It does look complicated to calculate, but the idea of splitting contigs when an error (at least a 5 bp indel) is found (they have Sanger-sequence reference genomes for 3 of them) before calculating the N50 size is just great. It’s simple and very effective. By using this statistic and comparing it to the original N50 size you can clearly detect aggressive assemblers that don’t mind adding errors vs highly conservative ones. Then, comparing …","date":1327449600,"expirydate":-62135596800,"kind":"page","lang":"en","lastmod":1741387190,"objectID":"a5a8c4850726b14a50d7e9e2c61516c6","permalink":"https://lcolladotor.github.io/2012/01/25/extensive-comments-and-review-about-the-recent-bake-off-of-de-novo-genome-assemblers-gage/","publishdate":"2012-01-25T00:00:00Z","relpermalink":"/2012/01/25/extensive-comments-and-review-about-the-recent-bake-off-of-de-novo-genome-assemblers-gage/","section":"post","summary":"During this week’s Genomics seminar at the Genome Cafe in the Biostats department, Steven Salzberg gave a talk on his team new published paper: GAGE: A critical evaluation of genome assemblies and assembly algorithms.","tags":["Genomics","De novo assembly","Paper comments"],"title":"Extensive comments and review about the recent bake-off of de novo genome assemblers \"GAGE\"","type":"post"},{"authors":null,"categories":["Ideas"],"content":"Simply Statistics: Why statisticians should join and launch startupsI really like this post in SimplyStatistics by leekgroup. The topic is worth considering, but what got me hooked was the list of links to startups, which were all new to me. 100plus looks promising, though I don’t have a clue as to what they are going to offer. Sure, I know the general topic, but not much beyond that. As I just flew back to town, Flightcaster and Hipmunk caught my attention. While Flightcaster works faster and has a great FAQ, I don’t find it super useful since it’s limited to US domestic flights, which are not the kind I usually jump into. Plus, without automatic updates it seems kind of a pain to use. After all, I don’t want to become a panic-driven person who has to refresh the status of his flight every hour or maybe even every few minutes. Hipmunk on the other hand is slow, but I like their “agony” ranking :) It also looks easy to find cheap days to fly though I’ll mostly cross-check with Expedia when I need it.\nAnyhow, to read more on the title subject check the original post at simplystatistics:\n\u0026gt; The tough economic times we live in, and the potential for big paydays, have made entrepreneurship cool. From the venture capitalist-in-chief, to the javascript coding mayor of New York, everyone is on board. No surprise there, successful startups lead to job creation which can have a… ","date":1327363200,"expirydate":-62135596800,"kind":"page","lang":"en","lastmod":1741387190,"objectID":"ffc70143991e8d28ba473de0b636d921","permalink":"https://lcolladotor.github.io/2012/01/24/simply-statistics-why-statisticians-should-join-and-launch-startups/","publishdate":"2012-01-24T00:00:00Z","relpermalink":"/2012/01/24/simply-statistics-why-statisticians-should-join-and-launch-startups/","section":"post","summary":"Simply Statistics: Why statisticians should join and launch startupsI really like this post in SimplyStatistics by leekgroup. The topic is worth considering, but what got me hooked was the list of links to startups, which were all new to me.","tags":["Industry"],"title":"Simply Statistics: Why statisticians should join and launch startups","type":"post"},{"authors":null,"categories":["Paper comments"],"content":"Today is my first day of classes and Kasper couldn’t have had a better timing to share the link to Genomics in 2011: challenges and opportunities. There, the Editorial Board members of Genome Biology gave their opinion on: important 2011 papers, influential people for their careers, advice to young scientists, top challenges in their field, and unlimited money projects. I felt identified several times and as:\nI think one of the most important skills in research is the ability to communicate ideas. […] practicing both writing skills and oral presentation skills.\nhere I am sharing my view on the paper.\nOverall the paper is a good read and I enjoyed most of it, so I highly recommend reading it.\nThe top papers section is quite broad and it felt to me like a huge abstract on many papers. Now I want to read the paper on “phenologs”, a concept that seems very simple and natural, and has helped understand a bit more what genes do (functional genomics).\nThe parts about influential people and unlimited money projects are not so interesting. I felt that it was too personal and I didn’t feel that it related to me much. Regardless, I’d like to highlight some parts of the text:\n\u0026gt; * […] showed me the fun of methodology development in computational biology \u0026gt; * […] emphasized establishing a solid foundation in computer science and statistics but also developed our skills to identify relevant and impactful biological questions \u0026gt; * His humble upbringing, ability to admit when he was wrong, and persistence for what was right has continued to inspire me. The advice section was very appealing to me and I felt reassured as some of the advice I gave even younger scientists (check my talk to LCG students) popped up. I surely learnt a few things too =)\n\u0026gt; * Surrounding yourself with people who are smarter than you also helps you raise your game. \u0026gt; * Published is better than perfect. \u0026gt; * Importance of communication \u0026gt; * you need to appreciate the biology as much as, if not more than, the statistical method or computer science \u0026gt; * The success of our field is ultimately measured by the impact we can have on our understanding of biology \u0026gt; * I would say it’s the ability to understand both the experimental and the computational sciences. […] I would learn the key principles in computational biology or at the very least the linguistics, and vice versa. I hadn’t taken consciousness of the fact that the amount of computing you can do (per dollar) is doubling every year while the size of genomic databases is going up by a factor of 10. I knew something was off and that we are getting more data, but I didn’t know the ratio. Plus, I have to agree with the comment that cloud computing is not going to be the solution though I’m not sure if:\nThe only solution is to discover fundamentally better algorithms for processing these databases.\nSure, we need better algorithms, but I think that it’s fair to ask for cleaner and higher-quality data. This doesn’t mean that the data format has to be simpler, as:\nFar too often, enough biological details are abstracted away so that the solution loses its biological relevance.\nSad, but true.\nI do agree with:\nAnother challenge is to educate people about genomics and to tone down the natural hype of the genomics field.\nJust as with any discipline, it’s not easy to explain your field to a random person and it’s a harder job when someone exaggerates a set of results.\nThe argument that RO1 NIH grants are not built for young genomics scientists is interesting and I do hope that it changes soon. Though I don’t have a clue as to how the following is going to happen:\n\u0026gt; the last challenge is to transform the academic review system in our institutions\n\u0026gt; Understanding the systems-level ecological rules governing microbial community structure\u0026lt; surely opened my eyes as it was one of my main interests a few years ago (and stills interests me ^^).\n\u0026gt; streamlining methods for turning next-generation data into actionable biology sounds very fancy!! It’s as fancy, and important, as developing new ways to visualize networks that take into account time instead of viewing all the possibilities at once.\nTo finish off the post, I agree completely with:\n\u0026gt;I believe the biggest bottleneck is the bioinformatics and the shortage of researchers in the field. There needs to be a big investment to address this shortage. Note that I think that there are lots of bioinformatics-converts: people who recently joined the field to fill in the gap in their lab. As:\n\u0026gt;In my opinion, too many computational biology researchers are working in isolation on marginally relevant problems or making incremental improvements in areas that have already been well-populated by methods that are already adequate. So, yes, we need more bioinformaticians as most labs have high-throughput experiments (with only one experiment you already need a bioinformatician), but I do hope that a good proportion of them are trained to develop methods and focus on important problems and …","date":1327276800,"expirydate":-62135596800,"kind":"page","lang":"en","lastmod":1741387190,"objectID":"d54d15179cb0f11a8c8a978a63e9f202","permalink":"https://lcolladotor.github.io/2012/01/23/commenting-genomics-in-2011/","publishdate":"2012-01-23T00:00:00Z","relpermalink":"/2012/01/23/commenting-genomics-in-2011/","section":"post","summary":"Today is my first day of classes and Kasper couldn’t have had a better timing to share the link to Genomics in 2011: challenges and opportunities. There, the Editorial Board members of Genome Biology gave their opinion on: important 2011 papers, influential people for their careers, advice to young scientists, top challenges in their field, and unlimited money projects.","tags":["Genomics","Paper comments"],"title":"Commenting: Genomics in 2011","type":"post"},{"authors":null,"categories":["Computing"],"content":"What makes a great programmer? I would have said training, motivation, a good and efficient framework for continuous learning from others such as reading blogs like R-bloggers (if you are an R programmer). Well, on the Occupational Digest blog they commented a paper where they found that the best predictor is programming knowledge. This is acquired through years of practice and makes sense. After all, even if you are a gifted person for something, if you don’t practice and learn from others you won’t get anywhere. So, welcome to school for life! :P\n","date":1323475200,"expirydate":-62135596800,"kind":"page","lang":"en","lastmod":1741387190,"objectID":"7932550ea0f6c092ecdf212bcc27277e","permalink":"https://lcolladotor.github.io/2011/12/10/are-you-good-at-programming-you-probably-practice-a-lot/","publishdate":"2011-12-10T00:00:00Z","relpermalink":"/2011/12/10/are-you-good-at-programming-you-probably-practice-a-lot/","section":"post","summary":"What makes a great programmer? I would have said training, motivation, a good and efficient framework for continuous learning from others such as reading blogs like R-bloggers (if you are an R programmer).","tags":["Computing"],"title":"Are you good at programming? You probably practice a lot!","type":"post"},{"authors":null,"categories":["rstats"],"content":"It’s been a while since I’ve been waiting for the release of a visualization package in Bioconductor. Back in 2008 I was really impressed by the power of GenomeGraphs and I have used it in multiple occasions. Yet from both the Bioconductor Developer Meeting in Heidelberg 2010 and BioC2011 I’ve been waiting for the release of the visualization tools developed by Michael Lawrence and Tengfei Yin at Genentech. So, after a long hiatus where I didn’t browse the biocviews in Bioconductor, I found out that Lawrence and Yin released ggbio and biovizBase (it’s more of an infrastructure package for ggbio) . I haven’t really had the time to play around with them, but it’s definitely worth exploring both of their vignette files: ggbio, biovizBase. I also think that they’ll fit very well in Bioconductor because quite a few of their examples involved the gamma of objects the BioC team has released for high-throughput sequencing (HTS) data. Meaning that they work well with objects from IRanges and GenomicRanges. Also, some of the examples use BAM files which are common nowadays in any HTS analysis pipeline. As a plus, ggbio uses ggplot2, which definitely makes clear nice plots.\nI expect ggbio to replace GenomeGraphs soon (although I love using it), but I’m also kind of disappointed that I didn’t see any of the cool examples from BioC2011 in ggbio’s vignette file. After all, visnab looked pretty impressive as you can see in this presentation. I don’t know if they decided to rename visnab into ggbio, or maybe they haven’t released visnab yet. Anyhow, give ggbio and biovizBase vignette files a look :)\n","date":1323129600,"expirydate":-62135596800,"kind":"page","lang":"en","lastmod":1741387190,"objectID":"8baa46ad22e7ca51b0170b10c5615885","permalink":"https://lcolladotor.github.io/2011/12/06/the-new-visualization-package-for-genome-data-in-bioconductor-ggbio/","publishdate":"2011-12-06T00:00:00Z","relpermalink":"/2011/12/06/the-new-visualization-package-for-genome-data-in-bioconductor-ggbio/","section":"post","summary":"It’s been a while since I’ve been waiting for the release of a visualization package in Bioconductor. Back in 2008 I was really impressed by the power of GenomeGraphs and I have used it in multiple occasions.","tags":["Bioconductor","Graphics"],"title":"The new visualization package for genome data in Bioconductor: ggbio","type":"post"},{"authors":null,"categories":["rstats","UNAM"],"content":"Around two weeks ago I gave a talk via skype to the first year students from the Undergraduate Program on Genomic Sciences (LCG in Spanish) from the National Autonomous University of Mexico (UNAM in Spanish). The talk was under the context of the Introduction to Bioinformatics Seminar Series whose goal is to familiarize the new students with the bioinformatics world. It used to be a course heavy on exploring database websites, some basic theory, and lots of new concepts and algorithm names. Like, what is BLAST? This year, the course involved several talks from former students (like myself) on their experience and current job (most of us are in graduate school).\nIn my case, I was invited to talk about Biostatistics and R as I was one of the first LCG students to learn and teach R to other students (including PhD students ^^): 12 hour intro to R and Bioconductor, R in an intro to statistics course, a full course on Bioconductor. I had a lot of fun preparing my talk as I tried to portray the three main currents in Biostatistics in a way that would be understandable, basic concepts such as a P-value, some basic R code (the students knew the super basics only), and doing so in a way that I would also pass how I see things. A key part for any bioinformatician, as I see it, is to have a good basic toolset. That’s why I tried to pass on many tips to these young students. Also, I do like to go back to the philosophy of science and whether we need hypothesis nowadays or just models based on the data. I definitely had to cover the topic of communication as I strongly believe that any researcher has to be able to communicate with a biostastician if they want their help in analyzing their data. Also, a biostatistician is not a stastistician, meaning that they have to understand the underlying biological question. I tried emphasizing this point with the students and I attempted to motivate them to take a basic stastistics and probability course (2 preferably). After all, biostatistics is key nowadays in science since biology has gone high-throughput.\nGiving the talk through skype was definitely a new experience for me. The best is to be in the classroom as you miss a lot of the interaction with the students. For instance, I didn’t always know who as asking the question and frequently I had to ask them to repeat it louder. Plus, I chose to share my desktop with them instead of having them watch at my face all the time. I guess it wasn’t easy for them to just watch a screen with a background voice for 2 hours :P But well, I hoped they liked it as much as I liked preparing it.\nIf you are interested in the talk, I uploaded the PDF file, the associated R file and the master Rnw file to Google Docs. The Rnw file can be useful if you are learning how to write Beamer presentations using Sweave and LaTeX.\nFinally, I was asked to prepare two short questions so that the teachers can evaluate the students. As a bonus for any of them reading my blog ^^ (I did portray blogs as an excellent way to update yourself) here they are:\nArgue why you need to learn (at least basic) Biostatistics and why it’s useful nowadays to analyze biological data. Based on the data from your recent experiment, you construct a 95% confidence interval (frequentist approach) for the mean of your variable of interest. What is the probability that the true mean of the distribution is contained in the confidence interval. Bonus: list 5 basic R plotting functions Answers:\nYou need to learn the basics (at least) of Biostatistics in order to be able to communicate with your biostatistician collaborator, and to analyze your own data specially by performing exploratory data analyses (EDA). Also, biological experiments nowadays generate a lot of data as biology has gone high-throughput. Biostatistics is specially useful in order to analyze all this data. 0 or 1 and you cannot know which is the case for your specific dataset. I mentioned: plot, hist, boxplot, qqplot, qqnorm, lines, points, abline, legend ","date":1322956800,"expirydate":-62135596800,"kind":"page","lang":"en","lastmod":1741387190,"objectID":"311336b6e6d605971a9ca7bc2c8d5cda","permalink":"https://lcolladotor.github.io/2011/12/04/introducing-biostatistics-to-first-year-lcg-students/","publishdate":"2011-12-04T00:00:00Z","relpermalink":"/2011/12/04/introducing-biostatistics-to-first-year-lcg-students/","section":"post","summary":"Around two weeks ago I gave a talk via skype to the first year students from the Undergraduate Program on Genomic Sciences (LCG in Spanish) from the National Autonomous University of Mexico (UNAM in Spanish).","tags":["Bioconductor","LCG"],"title":"Introducing Biostatistics to first year LCG students","type":"post"},{"authors":null,"categories":["Web"],"content":"Recently I talked about how to set up your own blog and now I’m going to continue by emphasizing the importance of an RSS feed. What is it? Basically it is a unique format in which content from frequently updated sites (like a blog) is syndicated. Web syndication allows you to share the content of your site (blog) to many different sites automatically. This is specially useful for people who are interested in following your blog. Sure, you can let them type your blog’s site each time or simply allow them to receive updates on their email, feed reader (I recommend Google Reader), etc. After all, you don’t want your followers to have to remember to visit your site every time if there is an easier option out there. Sure, you already made your blog social but that was meant to facilitate comments and sharing of your blog’s content by it’s visitors. While publishing your blog to Twitter will get initial visitors into the blog, an RSS feed will complete the job when they suscribe to it.\nBlogging platforms will normally create an RSS feed for your blog. Yet, this is a plain XML file which is just a pain to read. However, the good news is that you can burn your feed which makes it pretty. That’s where FeedBurner comes into play. To use it, you simply have to give it your RSS feed XML url and choose a name. For example, the RSS feed XML url for Fellgernon Bit is http://fellgernon.tumblr.com/rss which is rather ugly, but looks much better with FeedBurner at http://feeds.feedburner.com/FellgernonBit The content is readable and FeedBurner allows your visitors to suscribe using a wide variety of tools with a few clicks.\nThis is not the end, as you can create lots of interesting gadgets through FeedBurner. For example, you can add a link with the number of suscribers (as counted through FeedBurner):\nTo do so, enter the FeedBurner page for your blog then click on the “Publicize” tab and go to “FeedCount”. There you’ll have several options (like choosing the color, type, etc) and you’ll get a piece of html code that creates the link:\n\u0026lt;p\u0026gt;\u0026lt;a href=”http://feeds.feedburner.com/FellgernonBit”\u0026gt;\u0026lt;img src=”http://feeds.feedburner.com/~fc/FellgernonBit?bg=CC0033\u0026amp;amp;fg=444444\u0026amp;amp;anim=0” height=”26” width=”88” style=”border:0” alt=”” /\u0026gt;\u0026lt;/a\u0026gt;\u0026lt;/p\u0026gt;\nNow simply paste it in the html file of your blog wherever you want it to appear.\nFeedBurner offers other options, statistics, etc but I think that one of the most important one is BuzzBoost (again under the Publicize tab). This allows you to show the most recent entries of your blog in other sites you own. Friends might also want to link your blog. In my case, I’m using it show the most recent posts from salmoblog.org as I want to publicize it, plus I’m part of the contributors there. As with FeedCount, BuzzBoost has several options and will give you an html code. Here is the code for Fellgernon Bit:\n\u0026lt;script src=”http://feeds.feedburner.com/FellgernonBit?format=sigpro” type=”text/javascript” \u0026gt;\u0026lt;/script\u0026gt;\u0026lt;noscript\u0026gt;\u0026lt;p\u0026gt;Subscribe to RSS headline updates from: \u0026lt;a href=”http://feeds.feedburner.com/FellgernonBit”\u0026gt;\u0026lt;/a\u0026gt;\u0026lt;br/\u0026gt;Powered by FeedBurner\u0026lt;/p\u0026gt; \u0026lt;/noscript\u0026gt;\nIn the end, if you make your blog it’s worth the extra minutes to configure your RSS feed and make it easy for your visitors to suscribe to it. Plus, you can use FeedBurner to make it nice looking and add some cool gadgets if you want.\n","date":1322611200,"expirydate":-62135596800,"kind":"page","lang":"en","lastmod":1741387190,"objectID":"7a0757b6ad8b9f5e61e5861510011069","permalink":"https://lcolladotor.github.io/2011/11/30/make-it-easy-for-your-visitors-to-suscribe-with-a-burnt-rss-feed/","publishdate":"2011-11-30T00:00:00Z","relpermalink":"/2011/11/30/make-it-easy-for-your-visitors-to-suscribe-with-a-burnt-rss-feed/","section":"post","summary":"Recently I talked about how to set up your own blog and now I’m going to continue by emphasizing the importance of an RSS feed. What is it? Basically it is a unique format in which content from frequently updated sites (like a blog) is syndicated.","tags":["Blog"],"title":"Make it easy for your visitors to suscribe with a burnt RSS feed","type":"post"},{"authors":null,"categories":["Web"],"content":"Now that I’ve spent time re-doing Fellgernon Bit, I thought it’d be a good time my experience on setting up a socially-connected blog.\nFirst of all, you need to choose a blog platform. There are some around like Blogger and WordPress that are widely used and were some of the first platforms. In my case though, I really like how easy http://www.tumblr.com/ is to use. Once you register and have the default blog, go to the customize menu from the Tumblr dashboard and browse the Free Themes. I ended up choosing the Simple Things theme because I liked the way it looks and it already included some things I wanted like the Google+ button, Facebook and Twitter sharing. This theme also has several easy options so you can easily link your blog to Google Analytics. One of the very nice gadgets this theme has (as other Tumblr themes) is an easy to customize Disqus account. What is this? Basically, it’s a system for comments. If the visitor registers at Disqus they can choose to share their comments via the main social networks, which is something that I liked. An alternative is the Facebook Social Plugin, but I don’t like because only facebook-users can comment. I know this sounds strange to many of you, but I don’t think that everyone has a fb account and with newer alternatives I believe they’ll lose some of their current userbase. Anyhow, with Disqus visitors can use their Twitter, Fb, Google, OpenId, … accounts to identify themselves and they can easily have their comments appear in the social networks.\nOne of the cool things Disqus offers is an easy to install widget where visitors can see the top commenters, recent comments, and most discussed threads (or only of the three). To set it up, go to the Admin window and then go to the Tools tab and click on Code.\nAs you might have noticed, you will have to modify the html file from your theme if you want to connect it and/or add widgets. Don’t be afraid and just follow the simple instructions all these widgets give you.\nOnce you have your comment system set up, you might be interested in adding more social networks for your visitors to share your posts on. That’s where ShareThis becomes quite handy. Note that ShareThis allows you to add Twitter, Fb, Google+ so even if the theme you chose doesn’t come socially-connected you can do it through ShareThis. In my case, I only added the ShareThis button which pretty much allows visitors to use the whole system of social networks. This theme (and other Tumblr themes) allow you to link the RSS feed of your blog with FeedBurner which definitely makes your RSS feed look nicer and easy to subscribe to with tools like Google Reader.\nAnother cool widget to add to your blog is a Tag Cloud. This is probably the easiest widget to add and this excellent post describes all the steps you will want to follow. The only difficult part can be choosing where to add the code in the html file. In my case, I simply looked for the RSS tag and added it below. The div html tags can be useful when you are adding widgets.\nTo top your blog off, a must-have widget is LinkWithin. Basically, it adds 3-5 links to older posts from your blog which definitely helps keep your older posts in the loop. Otherwise they are simply lost in the eternity of the archive.\nFinally, don’t forget to change the settings of your blog from the Tumblr dashboard. You can make so every new post is automatically posted on your Twitter and Fb accounts (I hope they add Google+ soon). This might all seem like a lot of work, but it’s much quicker to do if you know what you are looking for. And I hope that it’ll be useful to you.\nHappy social-blogging!\n","date":1321747200,"expirydate":-62135596800,"kind":"page","lang":"en","lastmod":1555181620,"objectID":"1ffd55f8645a16c276ca2c896d7635db","permalink":"https://lcolladotor.github.io/2011/11/20/setting-up-your-blog/","publishdate":"2011-11-20T00:00:00Z","relpermalink":"/2011/11/20/setting-up-your-blog/","section":"post","summary":"Now that I’ve spent time re-doing Fellgernon Bit, I thought it’d be a good time my experience on setting up a socially-connected blog.\nFirst of all, you need to choose a blog platform.","tags":["Blog"],"title":"Setting up your blog","type":"post"},{"authors":["Leonardo Collado-Torres"],"categories":null,"content":"Blog post describing this talk\n","date":1321633758,"expirydate":-62135596800,"kind":"page","lang":"en","lastmod":1621020950,"objectID":"2e2fcfc8220bd837c41ae8354d477195","permalink":"https://lcolladotor.github.io/talk/introbiostats2011/","publishdate":"2011-11-18T16:29:18Z","relpermalink":"/talk/introbiostats2011/","section":"talk","summary":"Introduction to Biostatistics for LCG-UNAM students (2011 version)","tags":["LCG"],"title":"Introduction to R and Biostatistics","type":"talk"},{"authors":["Shank EA","Klepac-Ceraj V","Leonardo Collado-Torres","Powers GE","Losick R","Kolter R"],"categories":null,"content":" ","date":1320963220,"expirydate":-62135596800,"kind":"page","lang":"en","lastmod":1621960504,"objectID":"55488b9af27fef4650cd63d982a4f335","permalink":"https://lcolladotor.github.io/publication/2011-11_bsubtilis/","publishdate":"2011-11-10T17:13:40-05:00","relpermalink":"/publication/2011-11_bsubtilis/","section":"publication","summary":"Many different systems of bacterial interactions have been described. However, relatively few studies have explored how interactions between different microorganisms might influence bacterial development. To explore such interspecies interactions, we focused on Bacillus subtilis, which characteristically develops into matrix-producing cannibals before entering sporulation. We investigated whether organisms from the natural environment of B. subtilis—the soil—were able to alter the development of B.subtilis. To test this possibility, we developed a coculture microcolony screen in which we used fluorescent reporters to identify soil bacteria able to induce matrix production in B. subtilis. Most of the bacteria that influence matrix production in B. subtilis are members of the genus Bacillus, suggesting that such interactions may be predominantly with close relatives. The interactions we observed were mediated via two different mechanisms. One resulted in increased expression of matrix genes via the activation of a sensor histidine kinase, KinD. The second was kinase independent and conceivably functions by altering the relative subpopulations of B. subtilis cell types by preferentially killing noncannibals. These two mechanisms were grouped according to the inducing strain’s relatedness to B. subtilis. Our results suggest that bacteria preferentially alter their development in response to secreted molecules from closely related bacteria and do so using mechanisms that depend on the phylogenetic relatedness of the interacting bacteria.","tags":["B. subtilis","LCG"],"title":"Interspecies interactions that result in Bacillus subtilis forming biofilms are mediated mainly by members of its own genus","type":"publication"},{"authors":["Gama-Castro S","Salgado H","Peralta-Gil M","Santos-Zavaleta A","Muñiz-Rascado L","Solano-Lira H","Jimenez-Jacinto V","Weiss V","García-Sotelo JS","López-Fuentes A","Porrón-Sotelo L","Alquicira-Hernández S","Medina-Rivera A","Martínez-Flores I","Alquicira-Hernández K","Martínez-Adame R","Bonavides-Martínez C","Miranda-Ríos J","Huerta AM","Mendoza-Vargas A","Leonardo Collado-Torres","Taboada B","Vega-Alvarado L","Olvera M","Olvera L","Grande R","Morett E","Collado-Vides J"],"categories":null,"content":" ","date":1295474296,"expirydate":-62135596800,"kind":"page","lang":"en","lastmod":1621960504,"objectID":"5aba01c16f95c3d43e49b815bb2d3991","permalink":"https://lcolladotor.github.io/publication/2011-01_regulondbv7/","publishdate":"2011-01-19T16:58:16-05:00","relpermalink":"/publication/2011-01_regulondbv7/","section":"publication","summary":"RegulonDB (http://regulondb.ccg.unam.mx/) is the primary reference database of the best-known regulatory network of any free-living organism, that of Escherichia coli K-12. The major conceptual change since 3 years ago is an expanded biological context so that transcriptional regulation is now part of a unit that initiates with the signal and continues with the signal transduction to the core of regulation, modifying expression of the affected target genes responsible for the response. We call these genetic sensory response units, or Gensor Units. We have initiated their high-level curation, with graphic maps and superreactions with links to other databases. Additional connectivity uses expandable submaps. RegulonDB has summaries for every transcription factor (TF) and TF-binding sites with internal symmetry. Several DNA-binding motifs and their sizes have been redefined and relocated. In addition to data from the literature, we have incorporated our own information on transcription start sites (TSSs) and transcriptional units (TUs), obtained by using high-throughput whole-genome sequencing technologies. A new portable drawing tool for genomic features is also now available, as well as new ways to download the data, including web services, files for several relational database manager systems and text files including BioPAX format.","tags":["RegulonDB"],"title":"RegulonDB version 7.0: transcriptional regulation of Escherichia coli K-12 integrated within genetic sensory response units (Gensor Units)","type":"publication"},{"authors":["Leonardo Collado-Torres"],"categories":null,"content":" ","date":1290038400,"expirydate":-62135596800,"kind":"page","lang":"en","lastmod":1621020950,"objectID":"fbeb24fa1ac06335f8e7a00f7fba1e91","permalink":"https://lcolladotor.github.io/talk/biocdev2010/","publishdate":"2010-11-18T00:00:00Z","relpermalink":"/talk/biocdev2010/","section":"talk","summary":"Overview of the BacterialTranscription project and R package for the European Bioconductor Developers Meeting","tags":["Bacterial Transcription"],"title":"Bacterial Transcription","type":"talk"},{"authors":["Leonardo Collado-Torres"],"categories":null,"content":" ","date":1287525141,"expirydate":-62135596800,"kind":"page","lang":"en","lastmod":1683613619,"objectID":"8668b9d3d9cb699adc6df5d4a147a069","permalink":"https://lcolladotor.github.io/publication/poster2010/","publishdate":"2010-10-19T16:52:21-05:00","relpermalink":"/publication/poster2010/","section":"publication","summary":"Poster presented at EMBO Conference Series from Functional Genomics to Systems Biology 2010","tags":["Bacterial Transcription","Poster"],"title":"Global Analysis of Transcription Start Sites and Transcription Units in Bacterial Genomes","type":"publication"},{"authors":["Leonardo Collado-Torres"],"categories":null,"content":" ","date":1282233685,"expirydate":-62135596800,"kind":"page","lang":"en","lastmod":1621020950,"objectID":"e3eaa5033de66a845c93171beb844f49","permalink":"https://lcolladotor.github.io/talk/nnb2010/","publishdate":"2010-08-19T16:01:25Z","relpermalink":"/talk/nnb2010/","section":"talk","summary":"Introduction to High Throughput Sequencing analysis for the National Bioinformatics Node (NNB in Spanish) 2010 event","tags":["LCG"],"title":"Introduction to using Bioconductor for High Throughput Sequencing Analysis","type":"talk"},{"authors":["Leonardo Collado-Torres"],"categories":null,"content":" ","date":1280094741,"expirydate":-62135596800,"kind":"page","lang":"en","lastmod":1683613619,"objectID":"856a327deb80ce1af98270d2fec78213","permalink":"https://lcolladotor.github.io/publication/poster2010bioc/","publishdate":"2010-07-25T16:52:21-05:00","relpermalink":"/publication/poster2010bioc/","section":"publication","summary":"Poster presented at BioC2010","tags":["Bacterial Transcription","Poster"],"title":"Global Analysis of Transcription Start Sites and Transcription Units in Bacterial Genomes","type":"publication"},{"authors":["Leonardo Collado-Torres"],"categories":null,"content":" ","date":1228348800,"expirydate":-62135596800,"kind":"page","lang":"en","lastmod":1621020950,"objectID":"d87ecc11645022a35a174c8afeb6eed0","permalink":"https://lcolladotor.github.io/talk/fagos2008/","publishdate":"2008-12-04T00:00:00Z","relpermalink":"/talk/fagos2008/","section":"talk","summary":"LCG undergrad final project presentation with Sur Herrera-Paredes","tags":["LCG"],"title":"Bacteriófagos: analizando su diversidad","type":"talk"}]